Effect of Additional CPU on Page Response Time
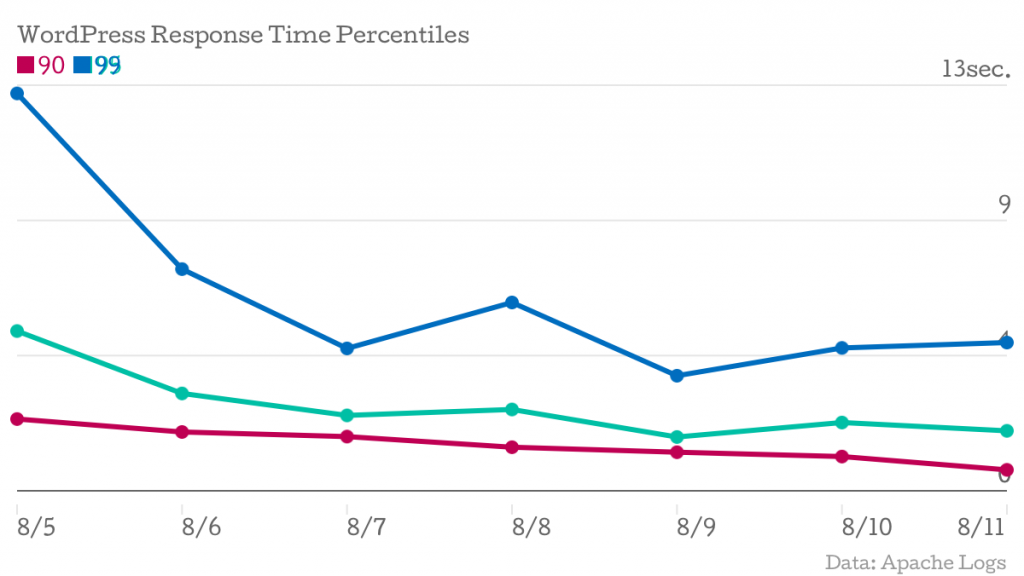
One of the major measurements we’re going by is the page response time, as measured by the Apache log files. With Dick’s help, I’ve pulled the log data from all three application servers for the time period of 8/5 through 8/11, and calculated the response times at the 90th, 95th, and 99th percentiles.
There are two points where we are hoping to see a decrease in the response times.
- On 8/8, Scott assigned two additional CPUs to ist-wp-app-prod02
- On 8/11, Scott assigned two additional CPUs to ist-wp-app-prod01 and ist-wp-app-prod03
| Date | 90 | 95 | 99 |
|---|---|---|---|
| 8/5/13 12:00 | 2.300289 | 5.120507 | 12.737408 |
| 8/6/13 12:00 | 1.884629 | 3.120386 | 7.105938 |
| 8/7/13 12:00 | 1.737026 | 2.416491 | 4.563435 |
| 8/8/13 12:00 | 1.396906 | 2.606436 | 6.035906 |
| 8/9/13 12:00 | 1.236931 | 1.724109 | 3.688222 |
| 8/10/13 12:00 | 1.097789 | 2.188232 | 4.578784 |
| 8/11/13 12:00 | 0.670928 | 1.922142 | 4.751131 |
The 99th, 95th, and 90th percentiles are represented by blue, green, and red lines, respectively.
The additional CPU resulted in a drastic reduction in system load on the application servers, but we do not see any indication that there is a similar improvement to overall page responsiveness. It is trending down, but not significantly.
It’s worth noting that this chart was generated only one day after all servers were upgraded with additional CPU. We’ll post updated charts over the coming days to see if an effect surfaces.
