Blog
bu-toolkit
I've create a Github repos:
https://github.com/bu-ist/bu-toolkit.git
… for housing tools and utilities we create for our performance analysis. Right now it contains only one script, bu-response-percentiles.py, which I used to calculate the response time percentiles referenced in my last post.
The "scripts" directory is intended to contain executable, installable scripts, that is, scripts that we might want to install to /usr/local/bin on our workstations.
The "sample" directory is intended to contain executable scripts that we might want to use passively. For example, a script that executes periodically and samples data about memory or CPU usage of a particular process group.
Effect of Additional CPU on Page Response Time
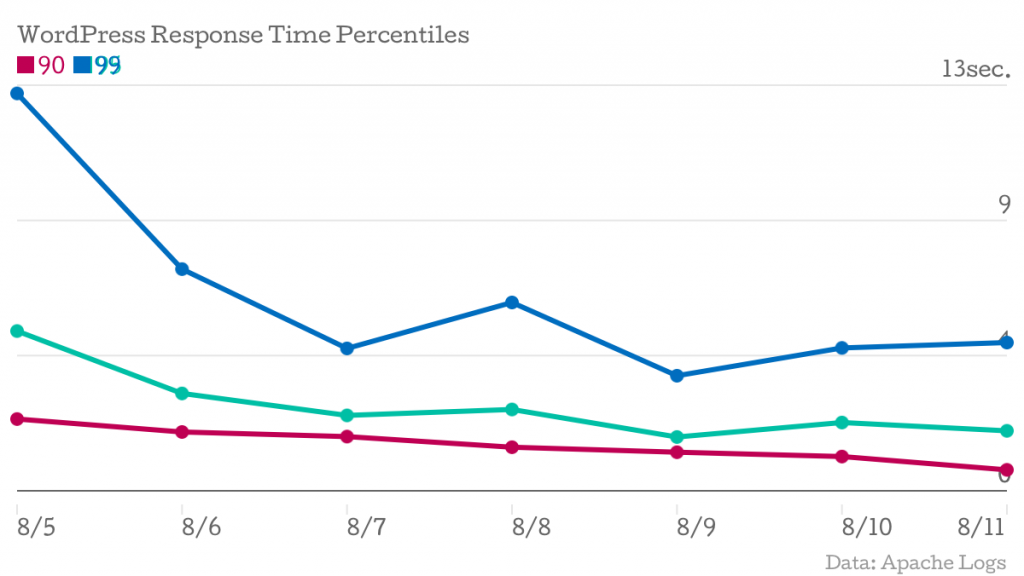
One of the major measurements we're going by is the page response time, as measured by the Apache log files. With Dick's help, I've pulled the log data from all three application servers for the time period of 8/5 through 8/11, and calculated the response times at the 90th, 95th, and 99th percentiles.
There are two points where we are hoping to see a decrease in the response times.
- On 8/8, Scott assigned two additional CPUs to ist-wp-app-prod02
- On 8/11, Scott assigned two additional CPUs to ist-wp-app-prod01 and ist-wp-app-prod03
| Date | 90 | 95 | 99 |
|---|---|---|---|
| 8/5/13 12:00 | 2.300289 | 5.120507 | 12.737408 |
| 8/6/13 12:00 | 1.884629 | 3.120386 | 7.105938 |
| 8/7/13 12:00 | 1.737026 | 2.416491 | 4.563435 |
| 8/8/13 12:00 | 1.396906 | 2.606436 | 6.035906 |
| 8/9/13 12:00 | 1.236931 | 1.724109 | 3.688222 |
| 8/10/13 12:00 | 1.097789 | 2.188232 | 4.578784 |
| 8/11/13 12:00 | 0.670928 | 1.922142 | 4.751131 |
The 99th, 95th, and 90th percentiles are represented by blue, green, and red lines, respectively.
The additional CPU resulted in a drastic reduction in system load on the application servers, but we do not see any indication that there is a similar improvement to overall page responsiveness. It is trending down, but not significantly.
It's worth noting that this chart was generated only one day after all servers were upgraded with additional CPU. We'll post updated charts over the coming days to see if an effect surfaces.
Benchmarking Memcached
We wanted a better understanding of how much time was being spent carrying out Memcached operations, and a deterministic method to benchmark operations isolated from the WordPress environment.
The result:
What does it do?
The script allows you to specify one or more memcached servers to test (host:port), as well as provide fixture data in the form of a JSON file.
The script does the following:
- Creates client Memcached instances using the PECL Memcache extension
- Loads fixture data and converts to PHP arrays
- Runs a simple benchmark -- set, get and delete provided cache data in sequence, timing each method as it runs
- Writes results to a CSV file
If you pass multiple memcached servers as input, the benchmarks will be run in two different modes:
- Pooled (one client sharing multiple servers)
- Individual (one client per server)
Gathering Test Data
We explored a few options for generating cache data to run through the benchmark script.
We leverged the built-in WP_Object_Cache class, specifically the one defined in the memcached object cache drop-in to extract actual cache data used during individual page requests.
function WP_Object_Cache() {
    . . .
    if ( defined( 'DUMP_CACHE_DATA' ) && DUMP_CACHE_DATA )
        register_shutdown_function( array( $this, 'cache_dump' ) );
    }
}

function cache_dump() {
    $filename = sprintf( '%s-%s.json', $_SERVER['HTTP_HOST'], rawurlencode( $_SERVER['REQUEST_URI'] ) );
    file_put_contents( "/tmp/cachedumps/$filename", json_encode( $this->cache ) );
    return true;
}
With this in place, cache dumps could be triggered by setting a constant in wp-config.php and pointing the browser at real pages in our install.
define( 'DUMP_CACHE_DATA', true );
The end result is a JSON file for each page, which we turned around and fed to the benchmark script.
Next Steps
Results coming soon...
Additional CPU Added to App Server
We added two additional cores to one of our three WordPress application servers to see what kind of effect it had on performance. This particular app server had been sustaining higher system load for the past couple of weeks, which we believe was caused by uneven memcached key distribution (the application servers also run our memcached servers).
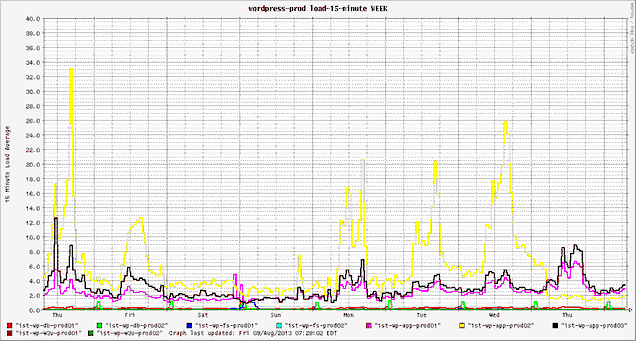
The initial news is that system load dropped significantly on the server.
The server is represented by the yellow line. We can also see that the massive load spikes appear to have evened out.
Unfortunately, most of the WordPress team was in training yesterday (and also today), so we've still got a lot of investigation and analysis to do. For example, the cache distribution was changed when we restarted the server to add CPU, and this may be contributing to the lower load.
Sampling memcached statistics
We recently launched a new environment for our WordPress CMS, making major changes to both the hardware (bare metal to VMs) and software (file-based WP Supercache to memcached-backed Batcache).
Unfortunately, we're having performance issues. Page response times are significantly down, and several intensive activities cannot be completed (fortunately these are rare and infrequently performed).
We'll be posting here as we investigate and, hopefully, address our performance problems.
One of the things we're lacking is good insight to how memcached is performing. To fix this, we're going to start collecting and analyzing statistics, both from the system (memory and CPU used by the memcached processes) and cache (from the memcached "stats" command).
There are a lot of tools out there that we could use to do this, but we're under a bit of a deadline as tomorrow we're going to be making a change to one of the VMs that memcached runs in. We'd like to be able to make some before and after comparisons, so I whipped together a really quick script to sample some data points we're interested in.
The script runs every minute from my crontab, and logs system and cache statistics to two CSV files.

