Memcached Benchmark Results
We used the memcached benchmark script to sample response times of common cache operations (get, set and delete) against different server configurations with data generated from actual WP requests.
Sample Data
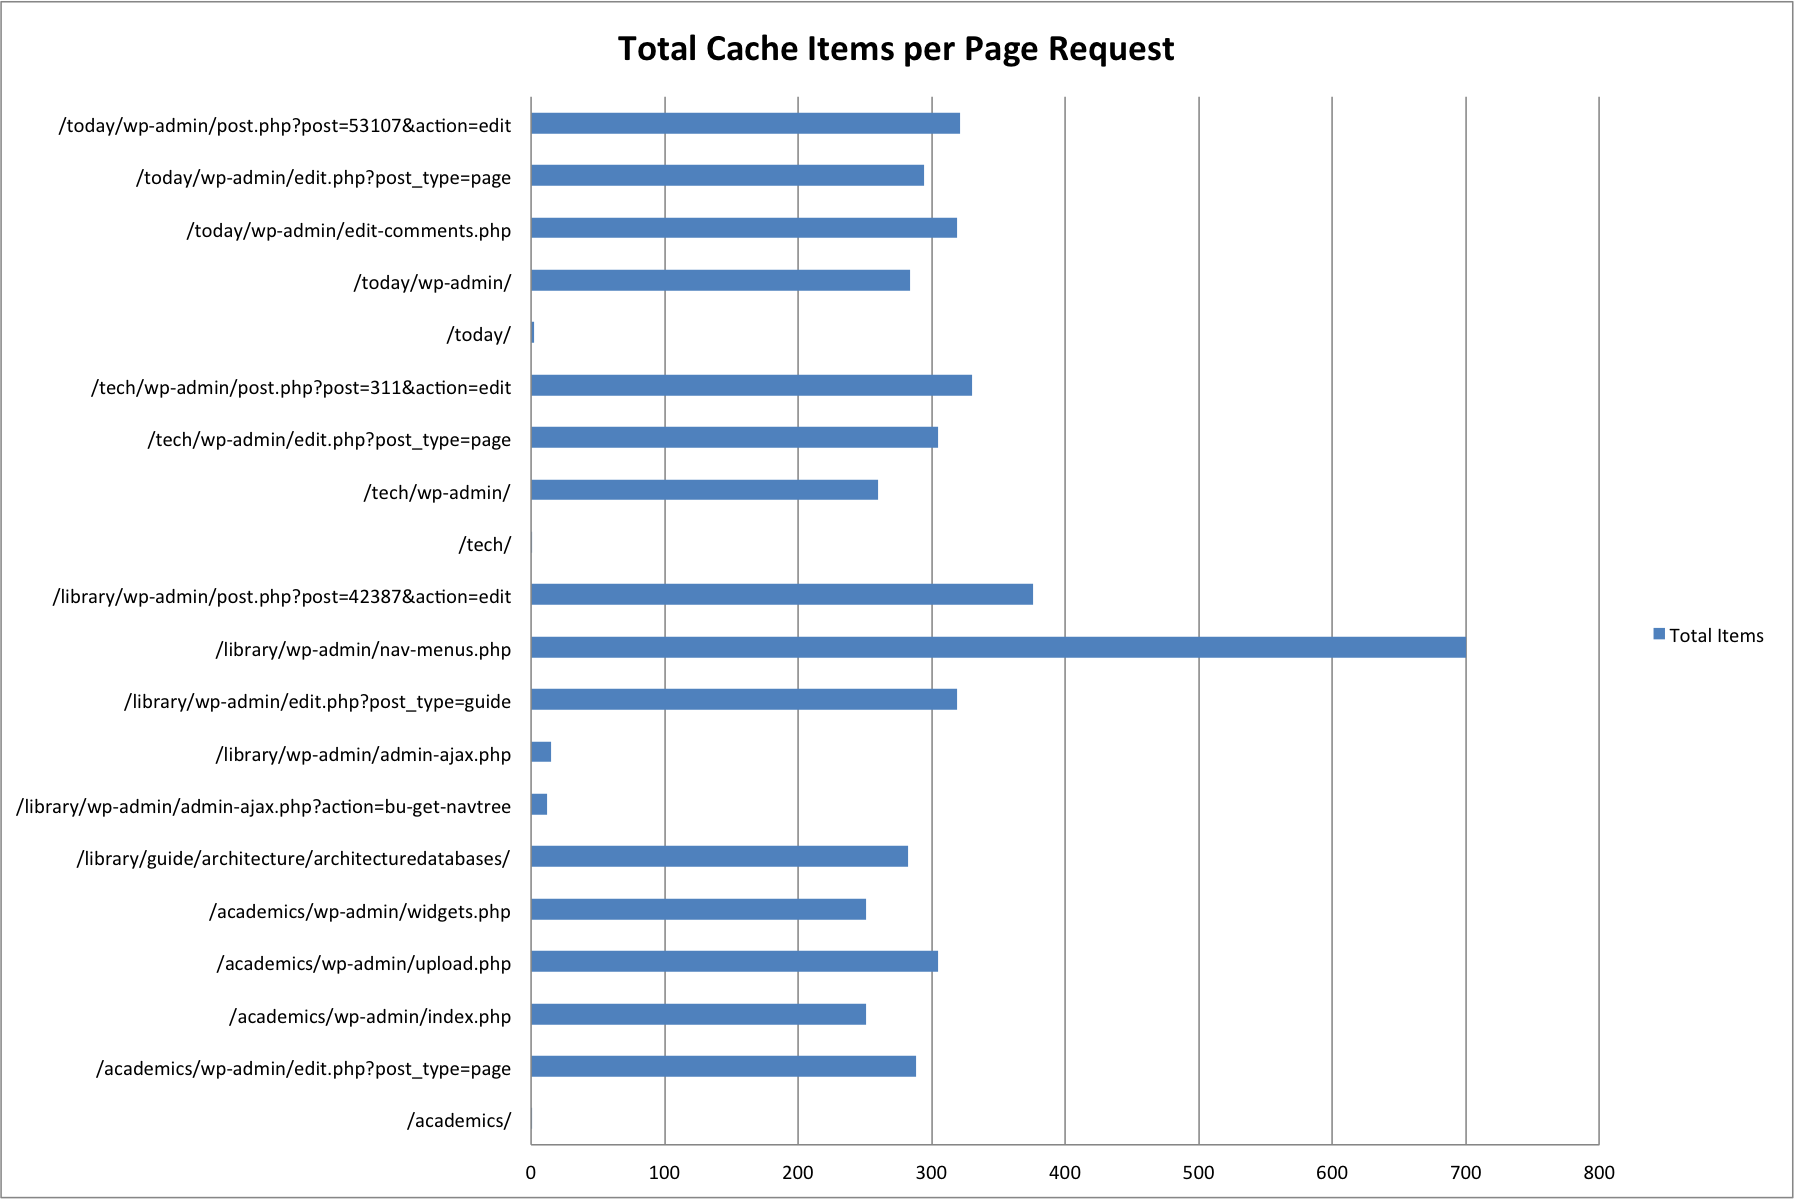
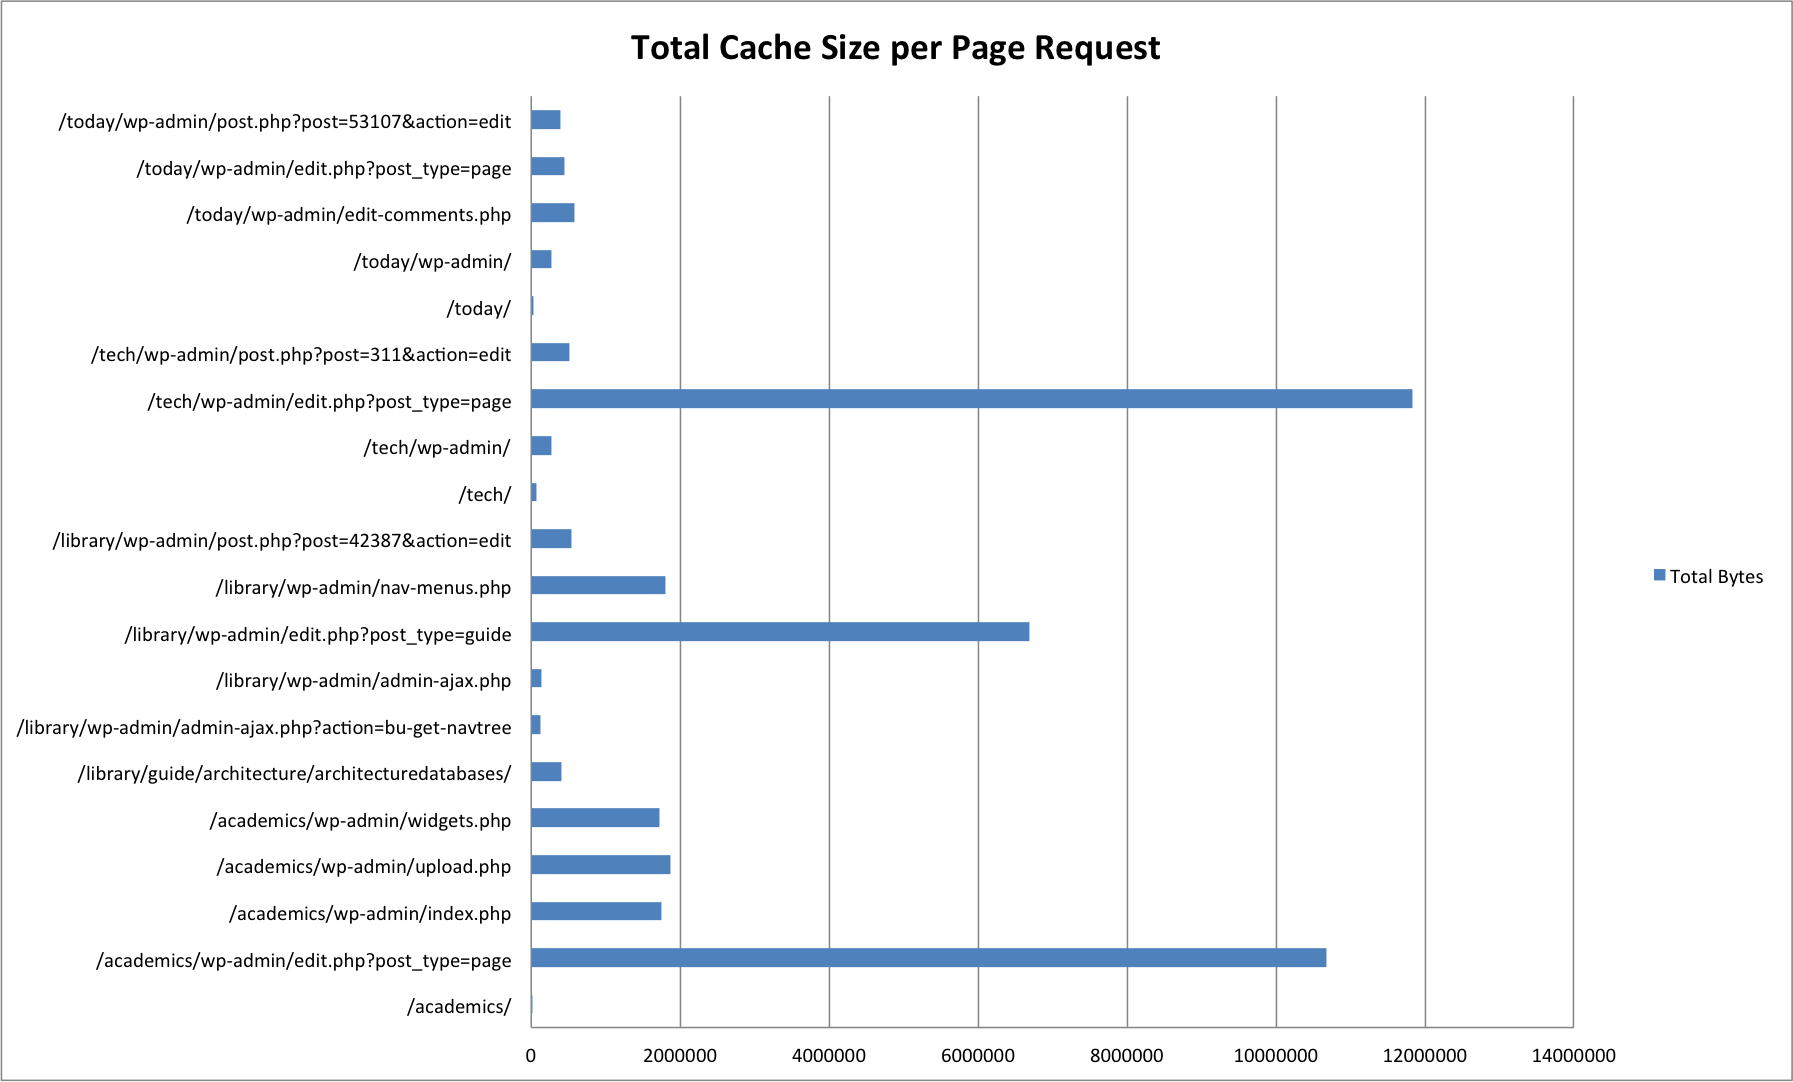
We generated sample cache data using 20 different pages across four of our more popular sites. Most of these page requests were for administrative pages (/wp-admin/), which make much heavier use of memcached in order to cache data structures returned from frequent / expensive database queries.
| URL | Cache Items | Size in Bytes |
|---|---|---|
| /academics/ | 1 | 15525 |
| /academics/wp-admin/edit.php?post_type=page | 288 | 10673318 |
| /academics/wp-admin/index.php | 251 | 1751822 |
| /academics/wp-admin/upload.php | 305 | 1867783 |
| /academics/wp-admin/widgets.php | 251 | 1723990 |
| /library/guide/architecture/architecturedatabases/ | 282 | 400303 |
| /library/wp-admin/admin-ajax.php?action=bu-get-navtree | 12 | 126930 |
| /library/wp-admin/admin-ajax.php | 15 | 136110 |
| /library/wp-admin/edit.php?post_type=guide | 319 | 6693282 |
| /library/wp-admin/nav-menus.php | 700 | 1805481 |
| /library/wp-admin/post.php?post=42387&action=edit | 376 | 536372 |
| /tech/ | 1 | 75212 |
| /tech/wp-admin/ | 260 | 270636 |
| /tech/wp-admin/edit.php?post_type=page | 305 | 11832297 |
| /tech/wp-admin/post.php?post=311&action=edit | 330 | 514797 |
| /today/ | 2 | 31772 |
| /today/wp-admin/ | 284 | 277221 |
| /today/wp-admin/edit-comments.php | 319 | 583105 |
| /today/wp-admin/edit.php?post_type=page | 294 | 441017 |
| /today/wp-admin/post.php?post=53107&action=edit | 321 | 396096 |
Pages without /wp-admin/ are front-end page requests. The majority of these have one or two cache items — this is due to the Batcache plugin, which stores fully generated HTML pages for front-end page requests by unauthenticated users.
Benchmark Environments
We ran the benchmark script against two different environments:
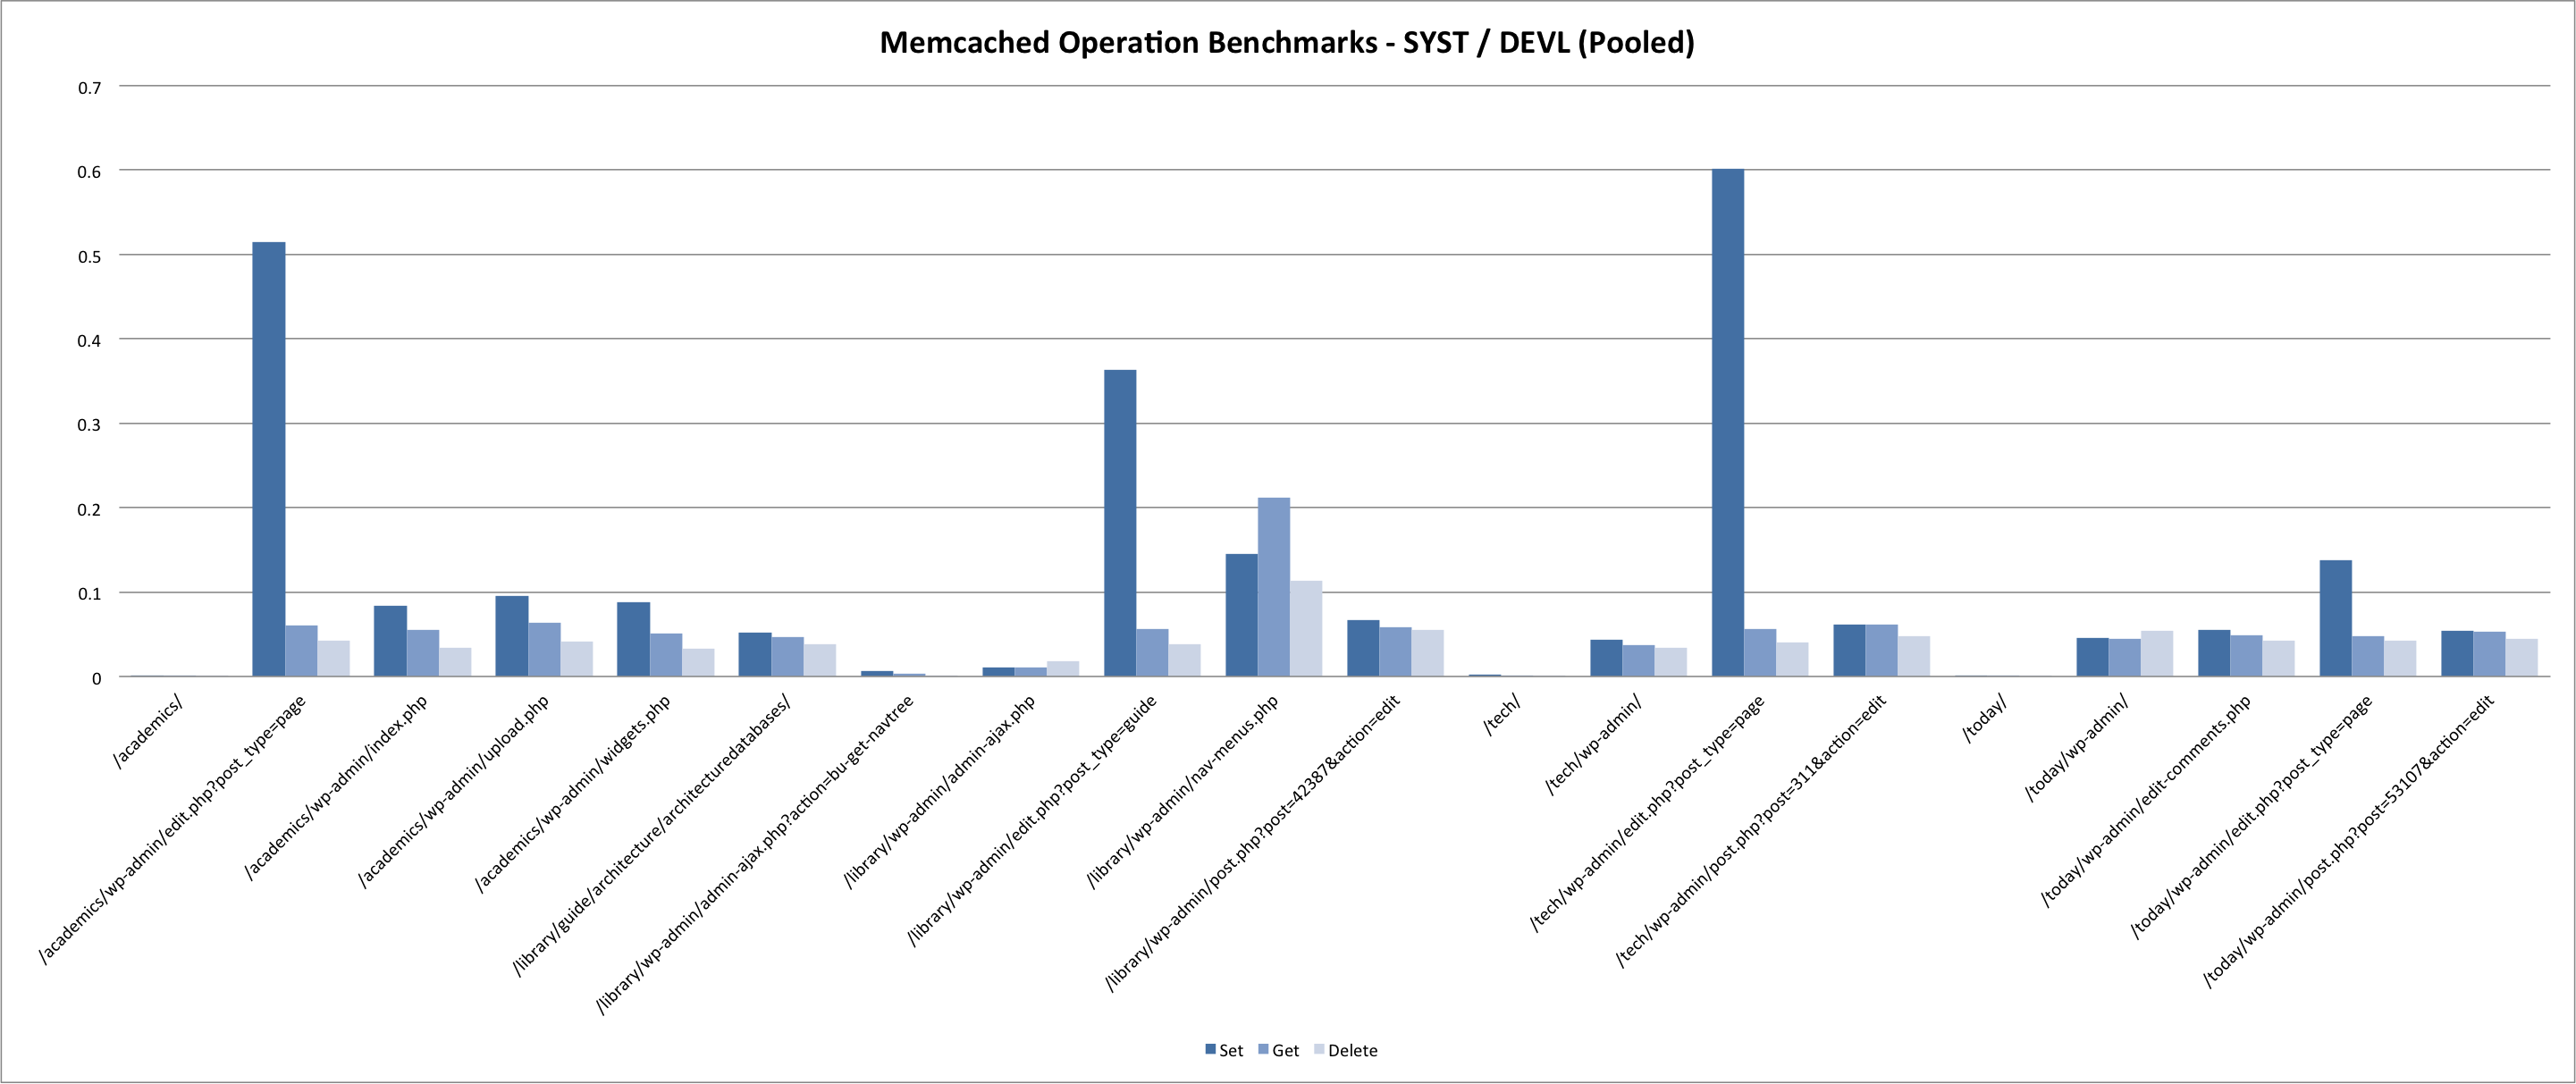
- Systems Test / Development
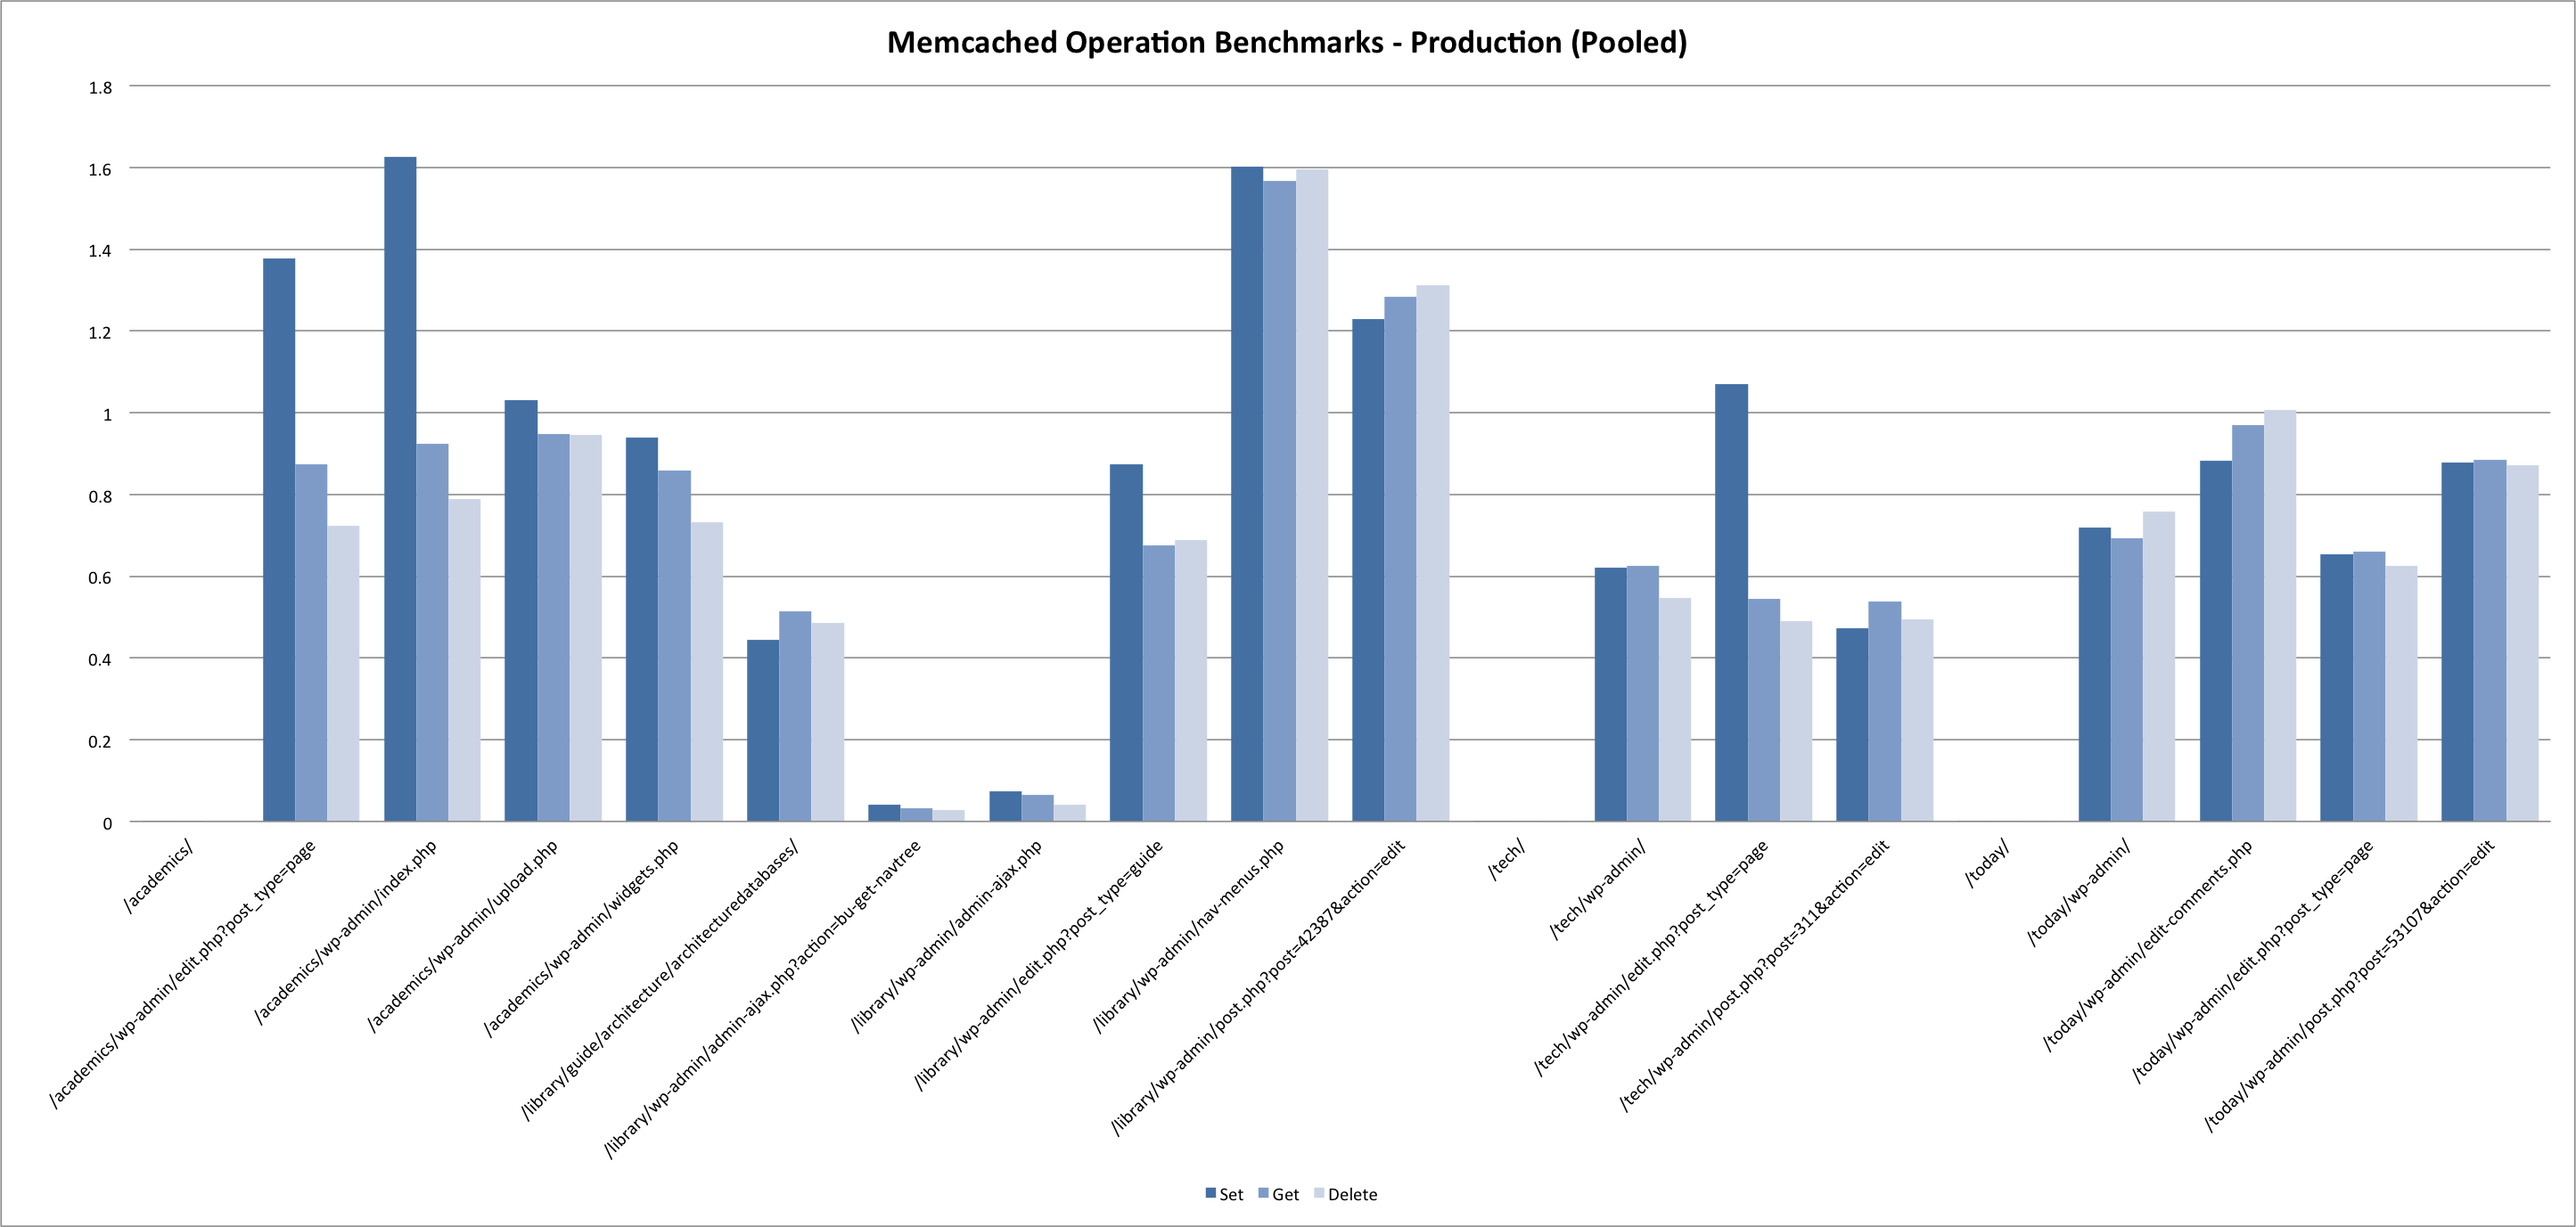
- Production
For each environment we spun up isolated memcached instances to handle client requests from the benchmark script.
There were some notable variances between test environments.
Memcached Configuration
# Systems Test / Development
ist-wp-app-syst01$ memcached -d -p 11212 -m 64 -c 1024
ist-wp-app-devl01$ memcached -d -p 11212 -m 64 -c 1024

# Production
ist-wp-app-prod01$ memcached -d -p 11214 -m 128 -c 1024
ist-wp-app-prod02$ memcached -d -p 11214 -m 128 -c 1024
ist-wp-app-prod03$ memcached -d -p 11214 -m 128 -c 1024
Where -p is the port to accept requests on, -c is the maximum amount of concurrent connections to accept, and -m is the amount of memory to allocate. Note that the sample data did not exceed 64M in size, and as such this variance did not make any difference — there were no cache evictions reported during test runs.
The benchmark scripts were run from ist-wp-app-syst01 for Systems Test / Development, and ist-wp-app-prod01 for production.
System Usage
While we did run the prod benchmarks during a low-traffic period, system usage was still vastly different from SYST / DEVL due to the volume of web requests being handled on the boxes running memcached. Systems test and development served a combined 68565 requests over a 24 hour period during which the benchmarks were run. In contrast, the production servers handled 4957761 during that same period.
15-minute load average across the 3 prod app servers averaged 2.1 during benchmark tests, with CPU usage hovering around 40%. This is compared to a 0.1 load average on ist-wp-app-devl01, with 5% CPU usage. (And even less on ist-wp-app-syst01).
Needless to say, we were not expecting the same results between environments.
Approach
The benchmark script does the following, starting from an empty cache:
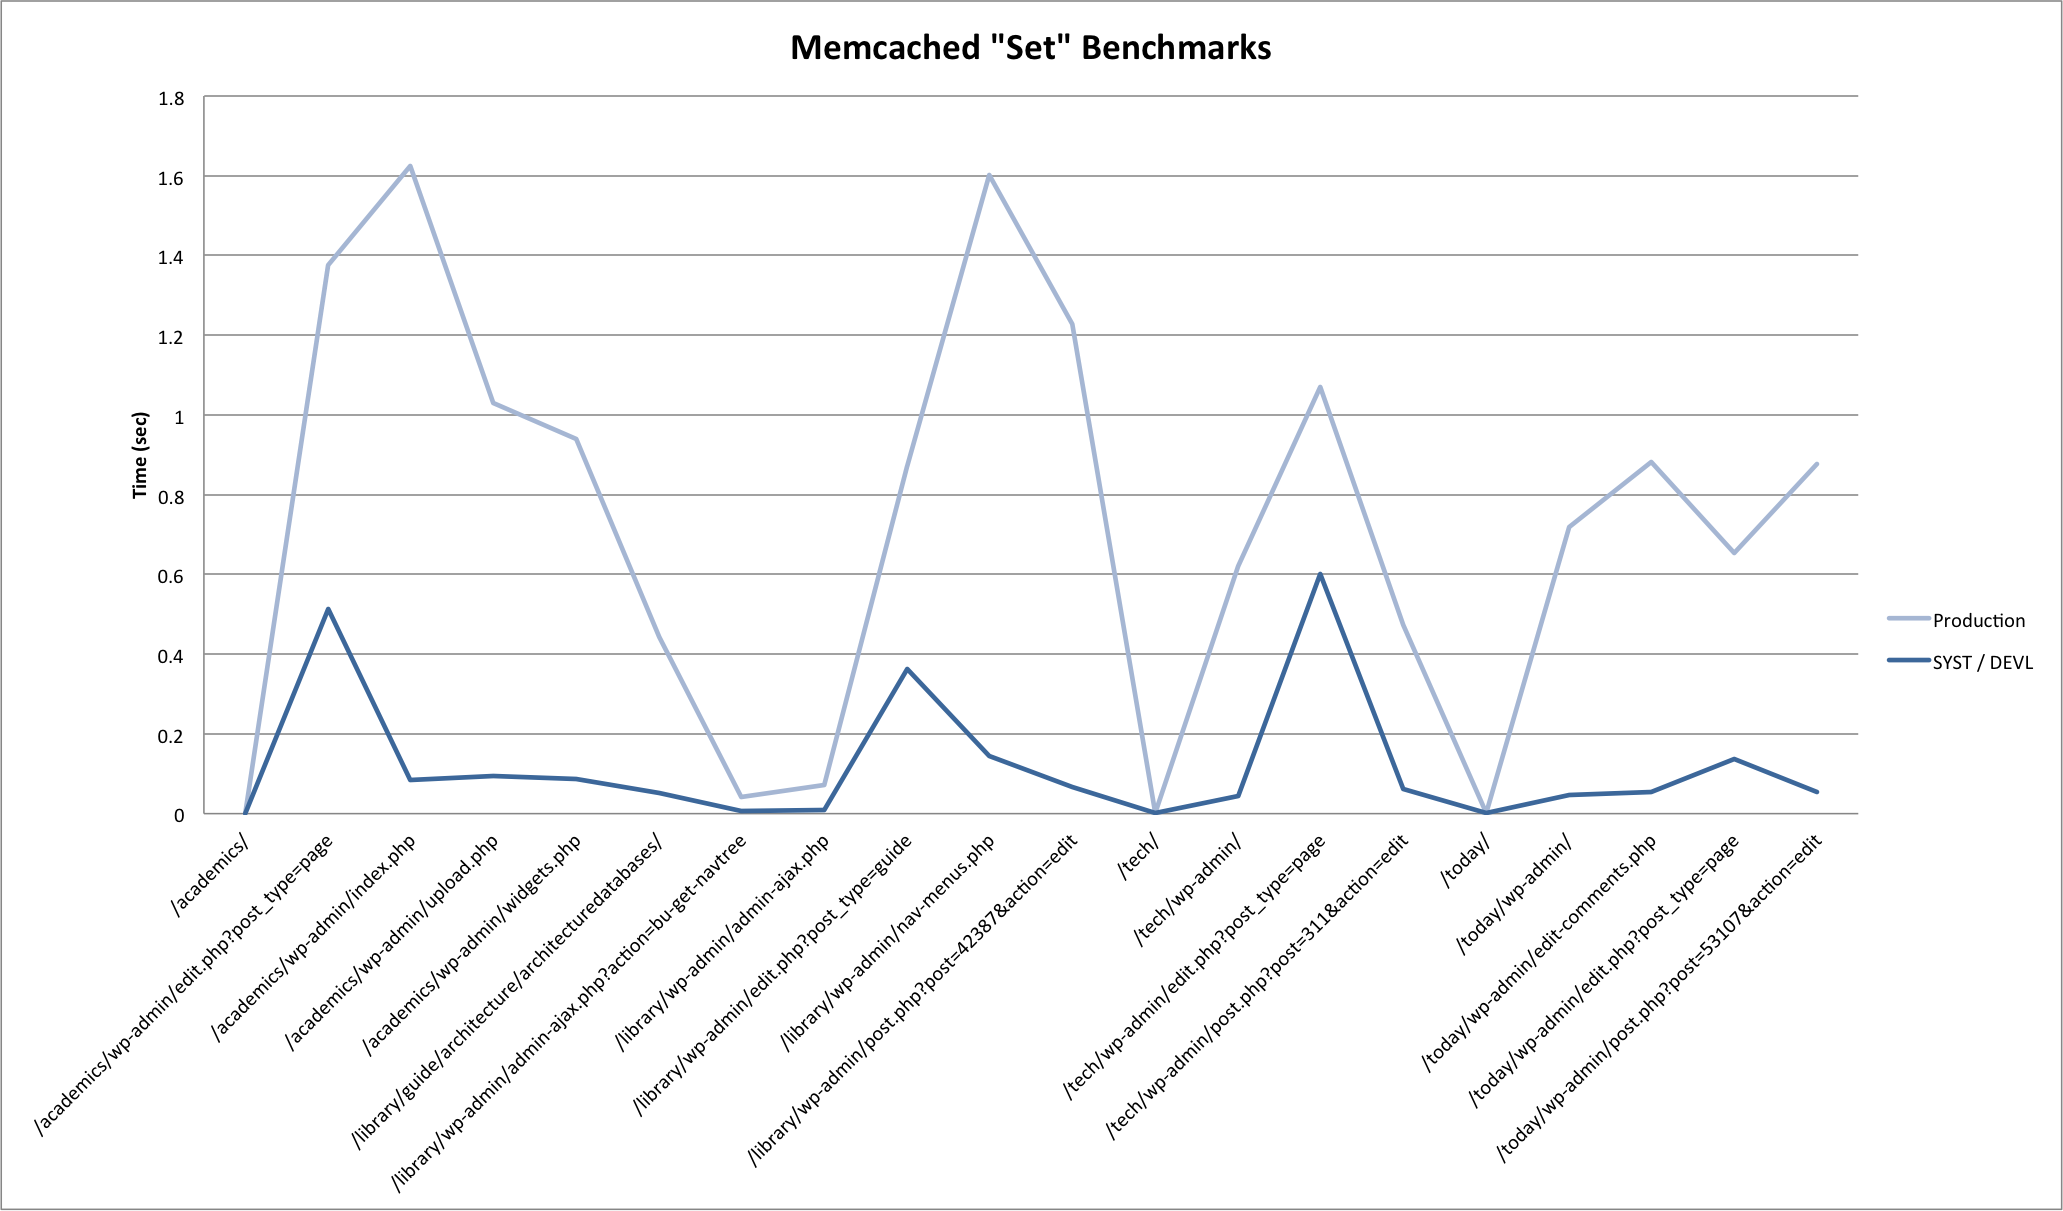
- Set all cache items for a given page request
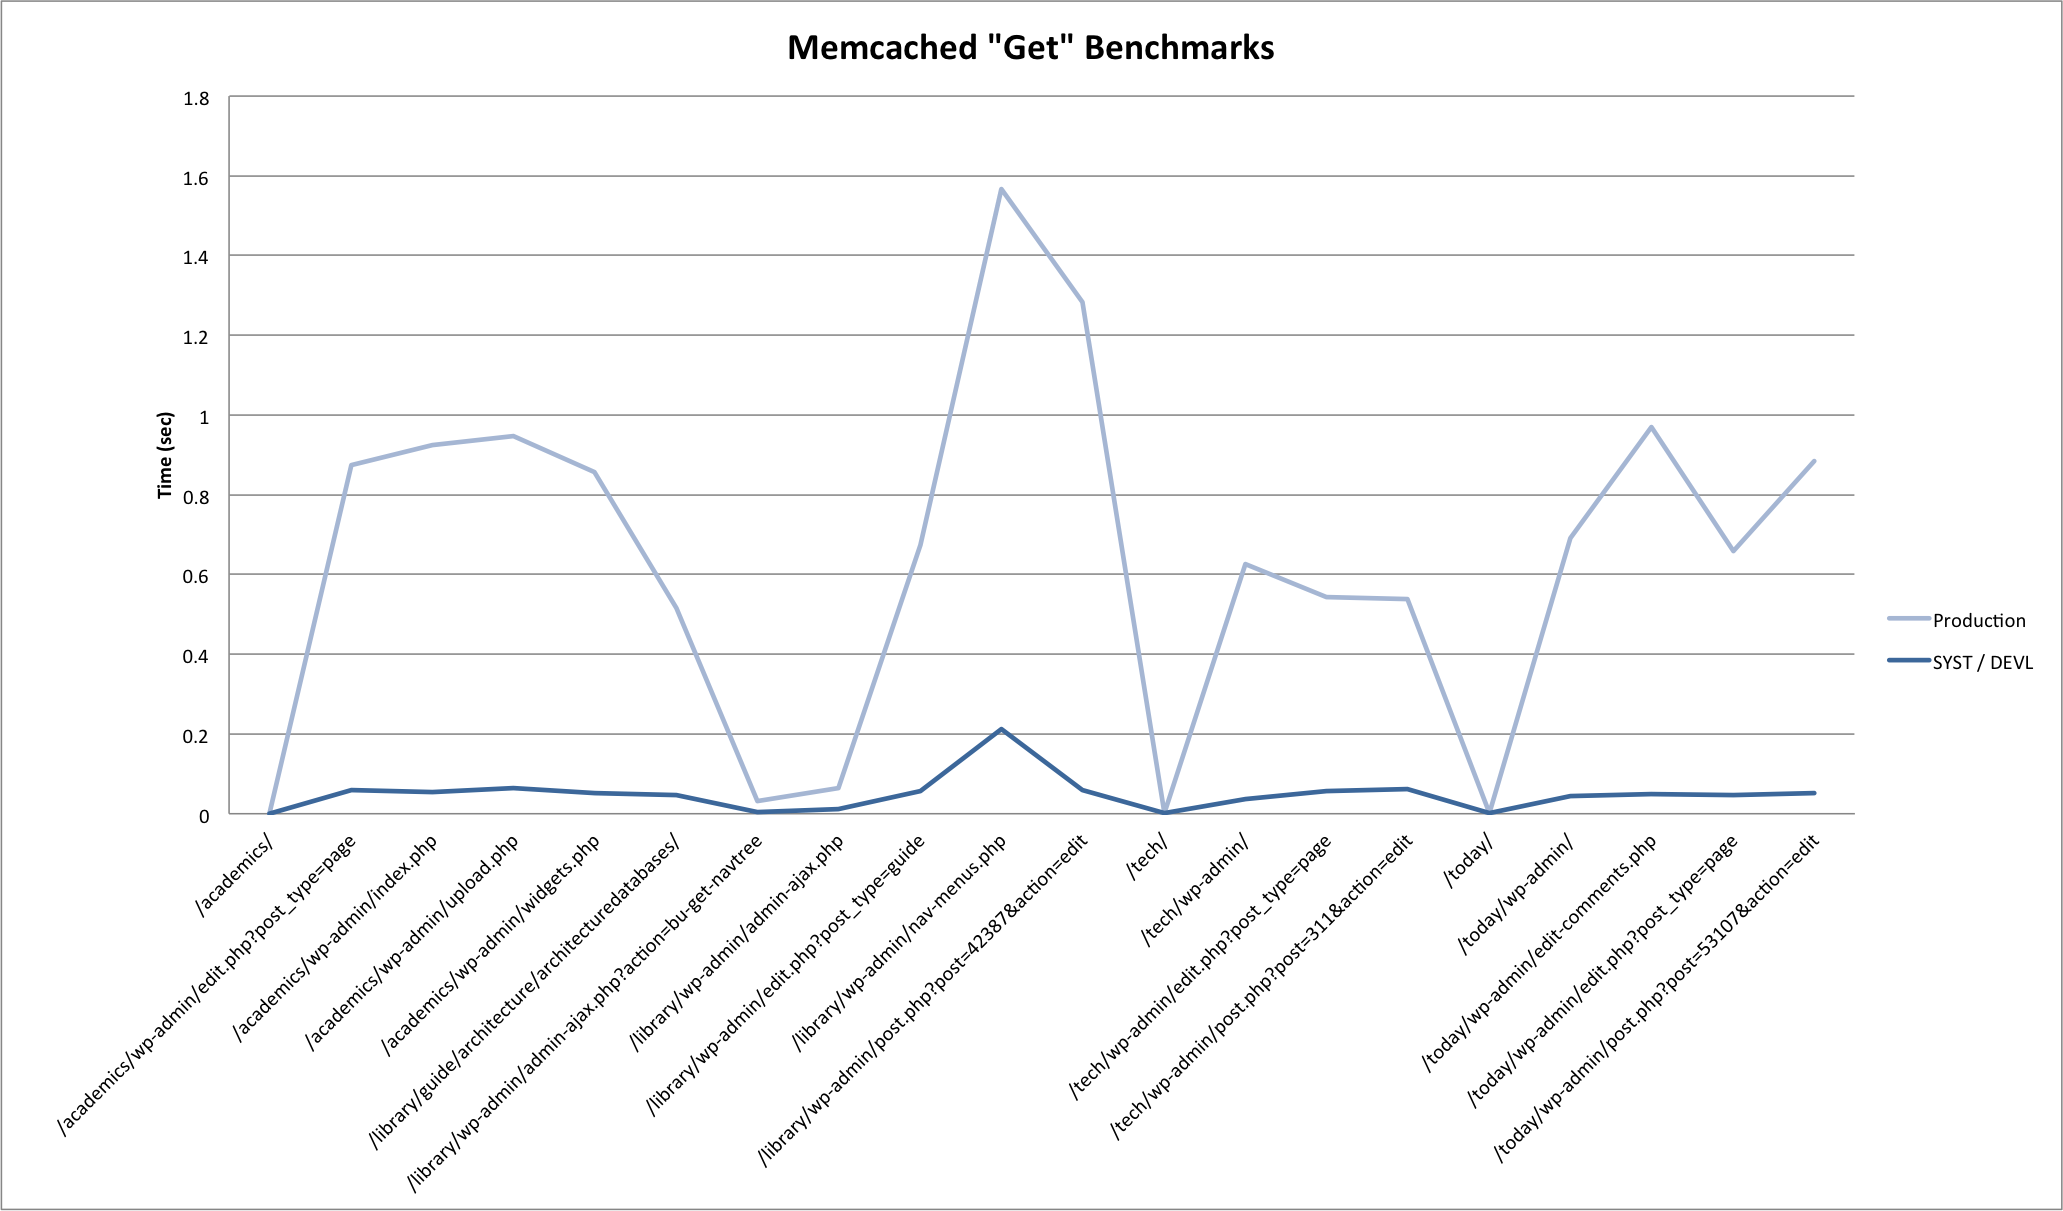
- Get all cache items for a given page requests
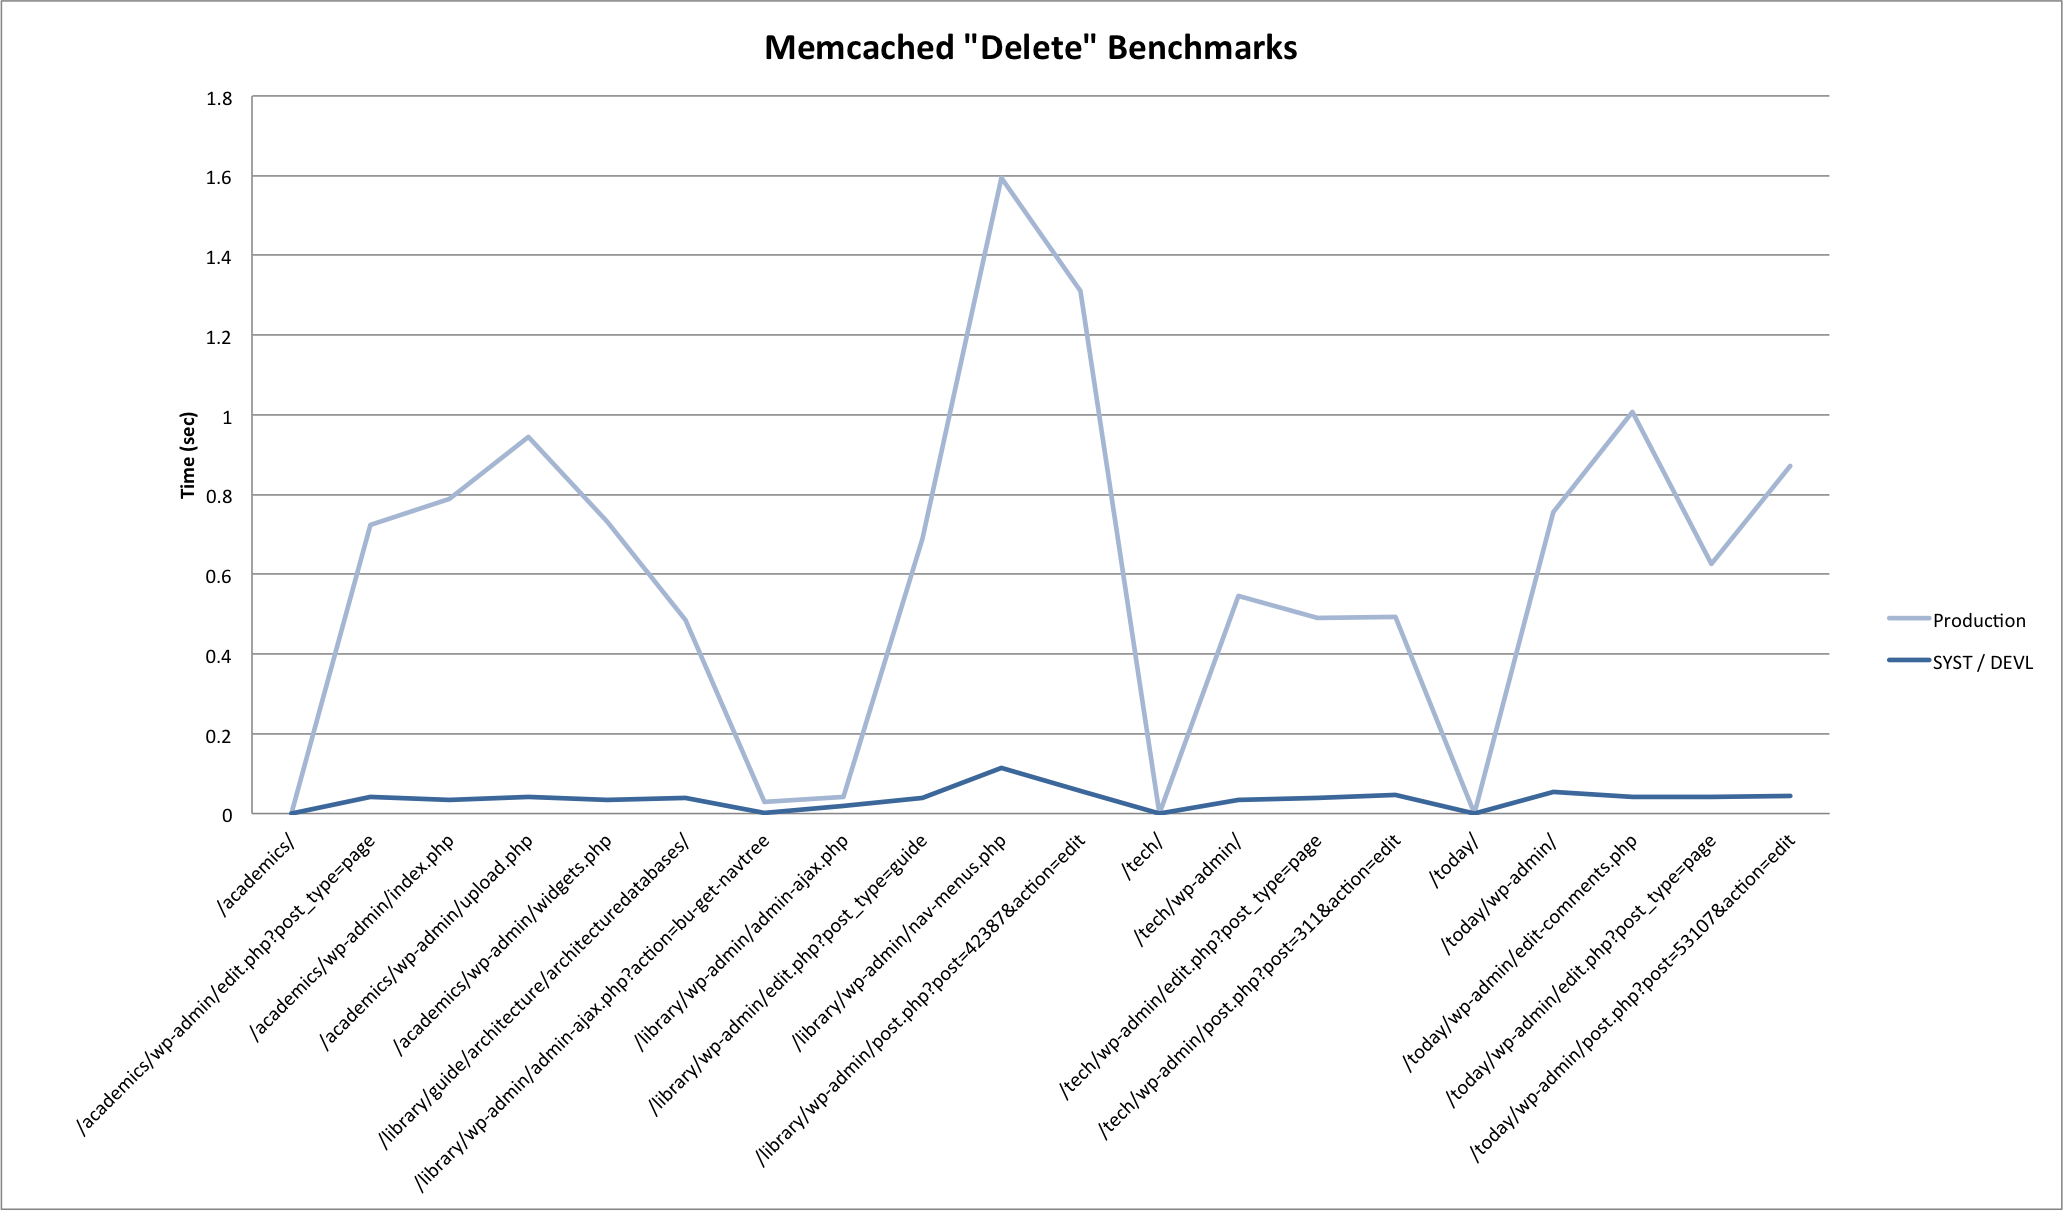
- Delete all cache items for a given page requets
It carries out these operations sequentially in two modes — pooled, and once per server.
With this test approach in mind, we were looking for answers to the following:
- How long do set, get and delete operations typically take in our environments?
- How do response times vary for these operations when the memcached server is local to the client? On the same blade? On a different blade?
- How do response times vary when the system is under load?
Results
Here are some graphs generated from the benchmark results. Click through to the attachment pages for some commentary.
Summary
Results pretty much confirmed what you would expect. In summary:
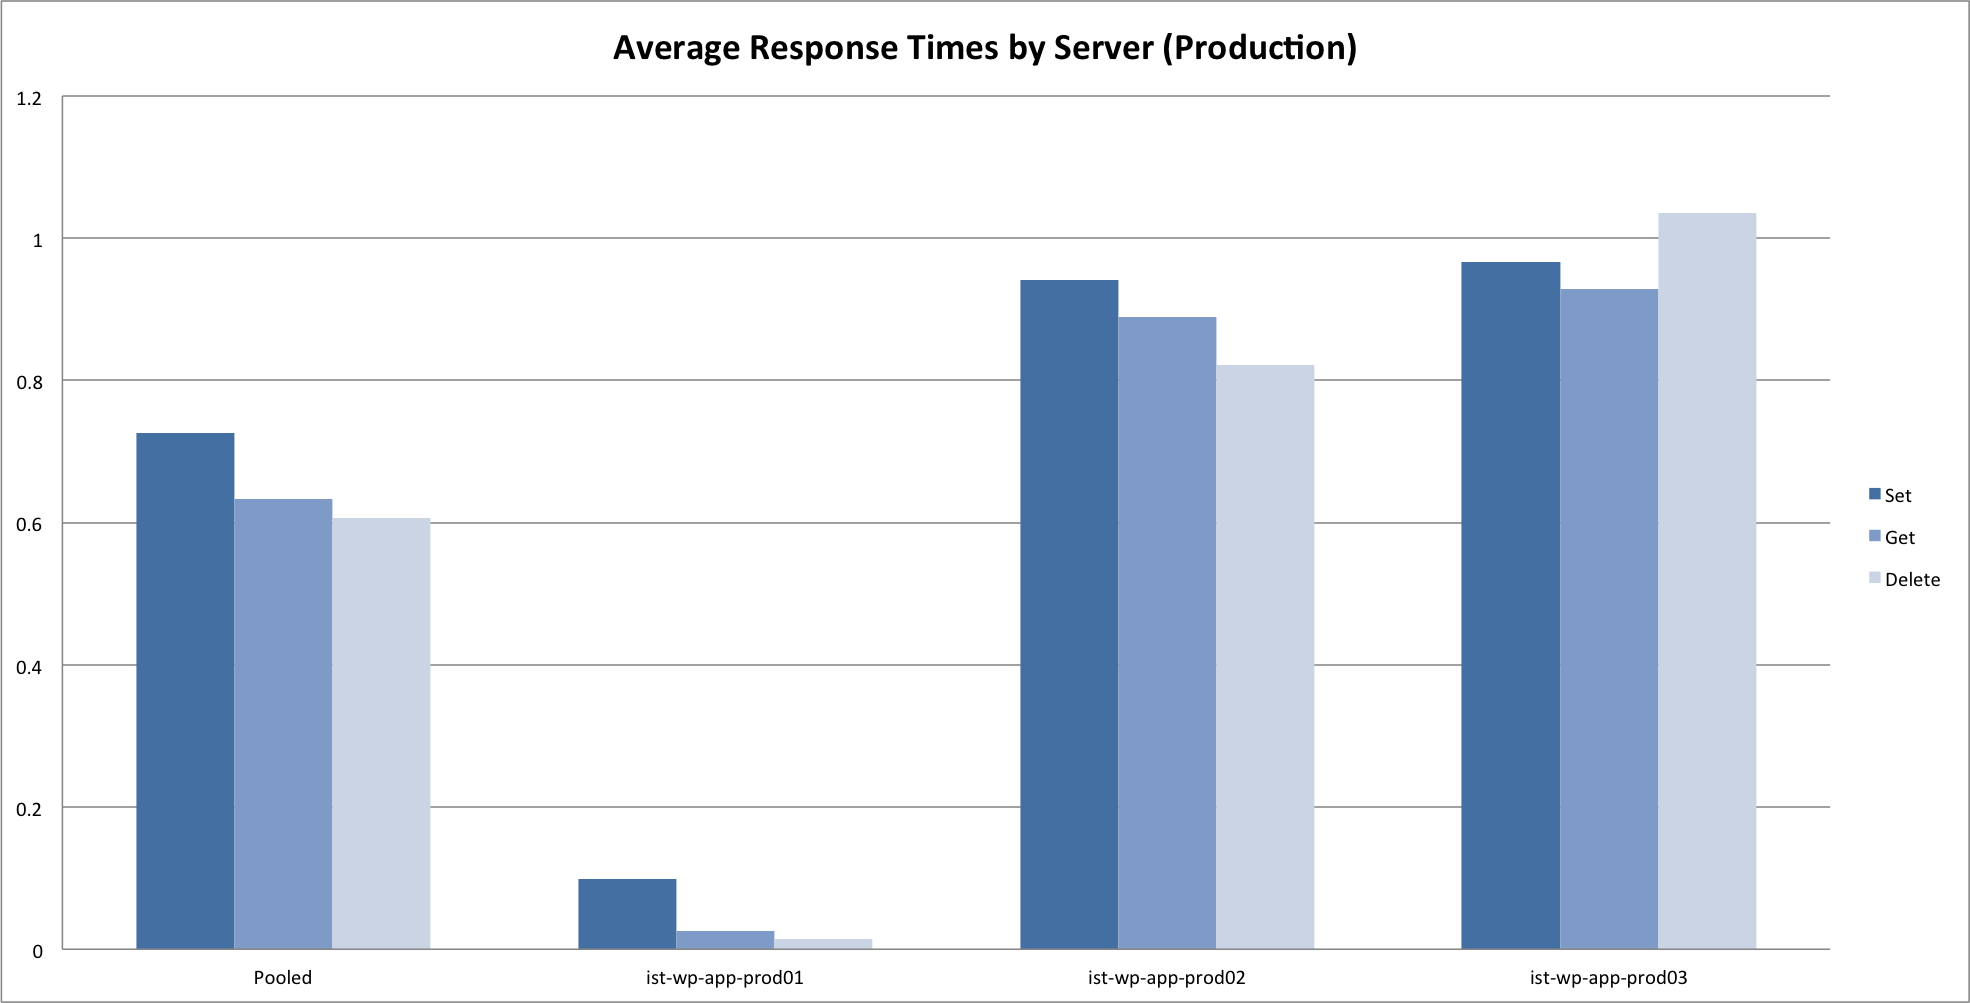
- Set is slower than get is slower than delete.
- Local requests are much faster then remote requests. For production, requests on the same blade (prod01 -> prod02) were marginally faster then requests across blades (prod01 -> prod03).
- System load greatly impacts response times for all memcached operations.
And some more questions…
- How much (if any) would response times improve by moving memcached to servers that were not overloaded serving web requests?
- How expensive are evictions? Default TTL for cache items is indefinite in the WordPress object cache plugin — should we consider expiring items at the cost of more frequent set operations?
More on that first point in a follow-up post, coming soon.