Blog
WP 4.6.2 Upgrade completed
We kicked off WP 4.1.1 Upgrade project on August 3rd, 2016 when WP 4.6 was still in betas. By the time we were ready to upgrade, WordPress 4.7 had come out. We completed the WP 4.6.2 upgrade project on Sunday January 14, 2017. The work took longer than expected due to significant staff shortage.
WP 4.1.1 Upgrade completed
We completed the WP 4.1.1 upgrade project (originally the WP 4.1 project) on Sunday March 8th, 2015.
We kicked off WP 4.1.1 Upgrade project back in November 25th, 2014 when WP 4.1 was still in betas.
In previous upgrades, we had waited until the official release of WordPress to get started on our upgrade projects. By the time we were ready to upgrade, another release of WordPress had come out due to shorter development cycles. So our announcements for upgrades were usually not as exciting for our users.
While working on the WP 4.1 upgrade, WP 4.1.1 had been released. WP 4.1.1 had minor fixes and no database changes. We added it to our timeline without any delays or problems.
It should be mentioned that the core WP team did not keep up with their "tentative" schedule during the betas, release candidates and release. So it was hard to wait for them.
WP 3.6.1 Upgrade has Begun!
It's official -- the next WordPress upgrade at BU has (finally) begun!
We are using the latest stable release -- 3.6.1 -- as there is not yet a release candidate for 3.7. It's worth mentioning that the core team has decided to follow in the footsteps of many other open source projects and shorten their development cycles. According to their roadmap, 3.7 will be out some time in October, followed by 3.8 in December.
BU devs and designers -- you can get yourself set up with a shiny 3.6.1 sandbox today:
https://developer.bu.edu/webteam/developer/libraryframework/wordpress/upgrade-to-3-6-1/
Comments now enabled
Comments are now enabled on this blog. This is the requisite test post :-)
Generating load using real browsers
Problem: Unrealistic Load Tests Problem
Previously at BU, we've used tools like Siege and NeoLoad to generate load on our test servers for our load testing. We've realized that this often doesn't create a realistic view of what happens when actual traffic hits our websites. The problem with these load test tools is that they do not make the dynamic javascript/css/etc requests that normal users or browsers also make. And they don't maintain a connection with the server long enough to get those assets, i.e. do not wait until the onload event is fired.
Solution: Load URLs using Real Browsers
I've created a load-urls.py script in the bu-toolkit repo which loads up urls from a file in multiple browsers at the same time. The script will wait until the onload event is fired on the page to consider it ready. It uses Selenium's webdriver library to facilitate this work and supports browsers such as PhantomJS (default), Firefox, and Chrome. The benefit of using PhantomJS is that it is by default a headless browsers, whereas the other browsers require special headless versions and/or virtual displays to get working optimally.
Analysis
Running some adhoc urls for our TEST servers, I was able to make the following observations:
| Threads | Load Average on each TEST server |
| 5 | ~1 |
| 10 | ~1.75 |
| 20 | ~3.25 |
It should be noted that I was not able to run the 20 threads on malahide server (the server used to run load-urls.py) for too long as it's own load average climbed up to 15. Also running the script for too long at just 10 threads may cause the server to become unresponsive, as it did to malahide server. So we need to use multiple servers set at 10 each to generate greater load for a short period of time. However, if the load needs to be maintained for a longer period of time, the task should be subdivided even further.
Response Times and Number of Requests

As we approach the Fall semester, traffic is starting to ramp up.

With the greater amount of data we can more confidently draw some conclusions. While the addition of CPUs to the application servers had a definite, measurable positive effect on system load, this did not translate into much, if any, of an impact on request response times, which are still creeping up.
A reminder: we had several site launches around that response time spike which resulted in a rather odd distribution of items in our memcached layer. It's possible the additional CPU did have an effect on response time, but it is not apparent because it is merely mitigating the degradation caused by the uneven cache distribution.
Application Response Time
A quick update on application response times. If you recall, we recently added additional CPU to our application servers:
- On 8/8, Scott assigned two additional CPUs to ist-wp-app-prod02
- On 8/11, Scott assigned two additional CPUs to ist-wp-app-prod01 and ist-wp-app-prod03
Here's an updated chart with some additional data.

Whereas our last post detailing response times suffered because we didn't have enough data after the adjustment to the environment, this post clearly highlights how not having enough data before the adjustment is making it difficult to draw conclusions.
It does look promising, though. Performance is slightly better overall, and does not appear to be spiking heavily from day to day.
I am going to pull additional logs from prior to the adjustment and create an updated chart later today.
Memcached Results, Continued
My last post end with a few questions. I realized as I was writing them that I had an easy way to answer one of them -- "How much (if any) would response times improve by moving memcached to servers that were not overloaded serving web requests?".

This graph is similar to this one from my previous post, but adds a fourth server to the memcached pool: ist-wp-app-prod04. When I ran these benchmarks, app-prod04 was not yet accepting web requests, and as such is representative of response times we might see if the memcached instance was not running on a busy app server.
Response times from app-prod04 are nearly 50% quicker than the other remote instances (app-prod02 and 03). Again the benchmark was run from ist-wp-app-prod01, so response times from that instance are still (understandably) the quickest.
Seems like a good argument for moving memcached off of the app servers...
Memcached Benchmark Results
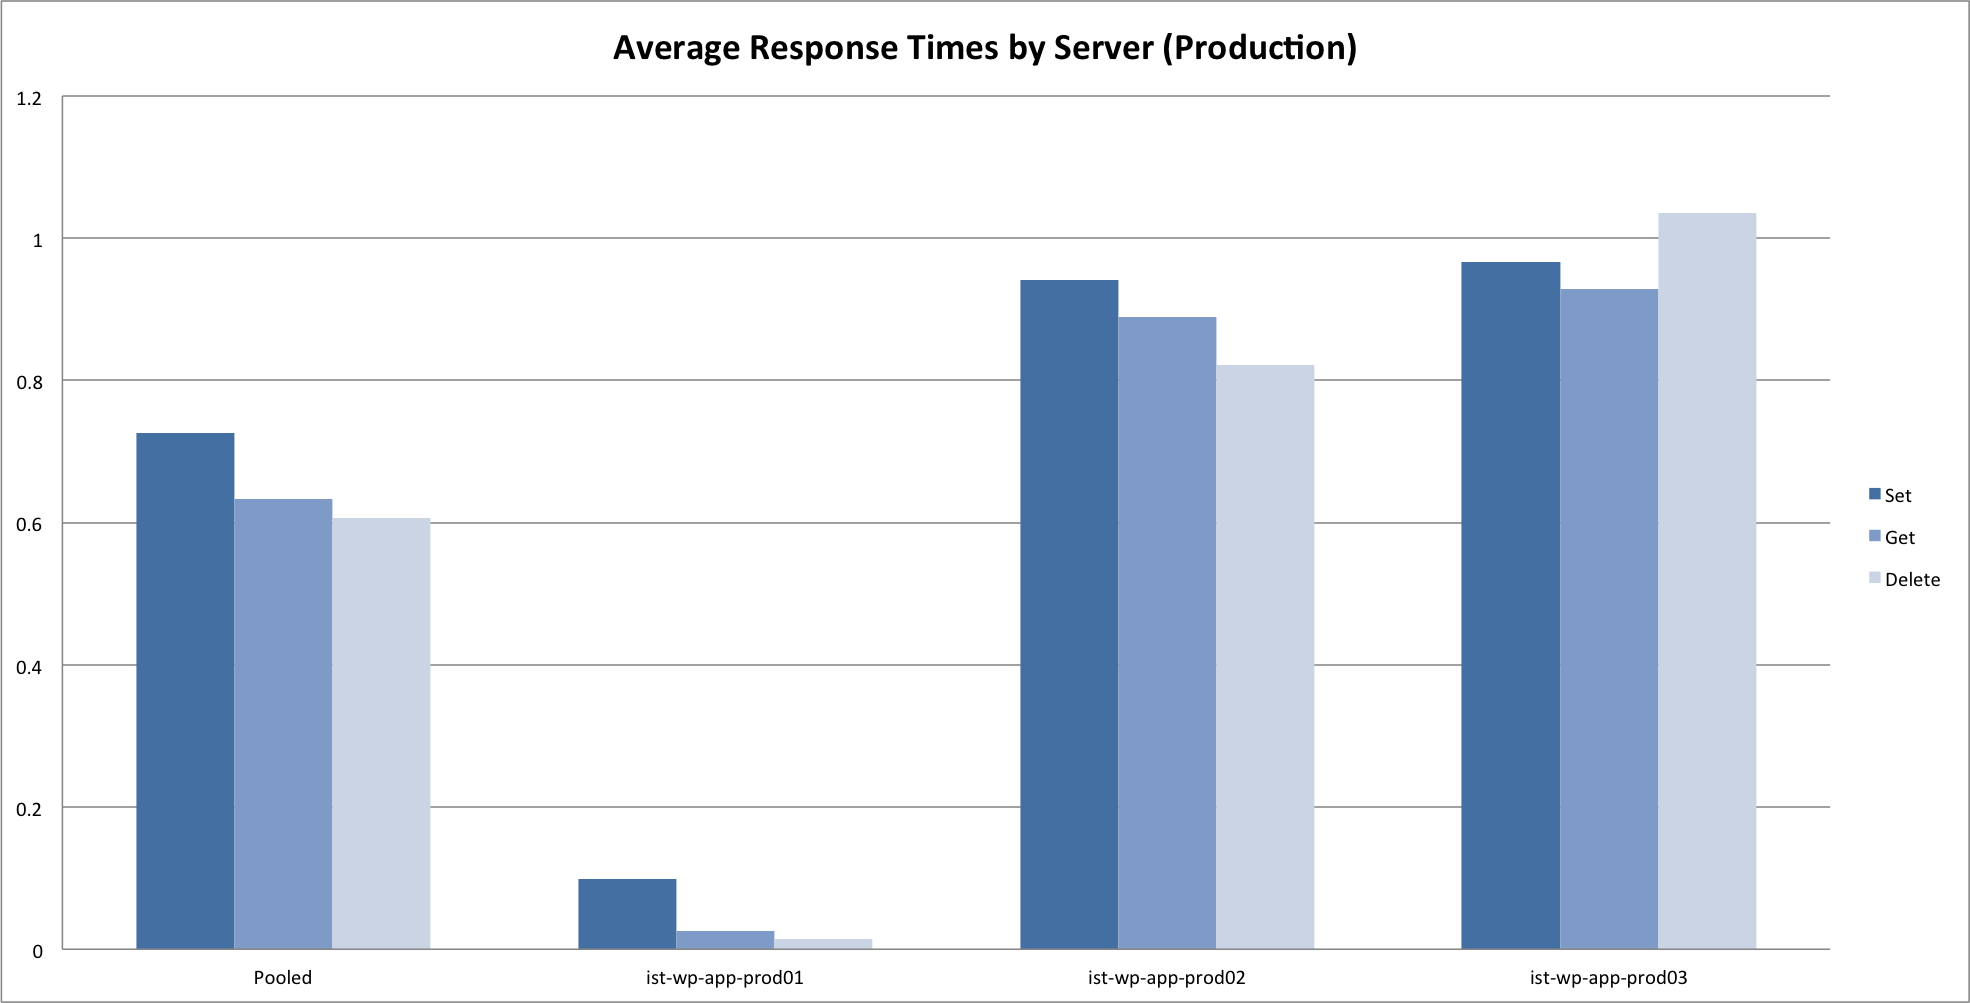
We used the memcached benchmark script to sample response times of common cache operations (get, set and delete) against different server configurations with data generated from actual WP requests.
Sample Data
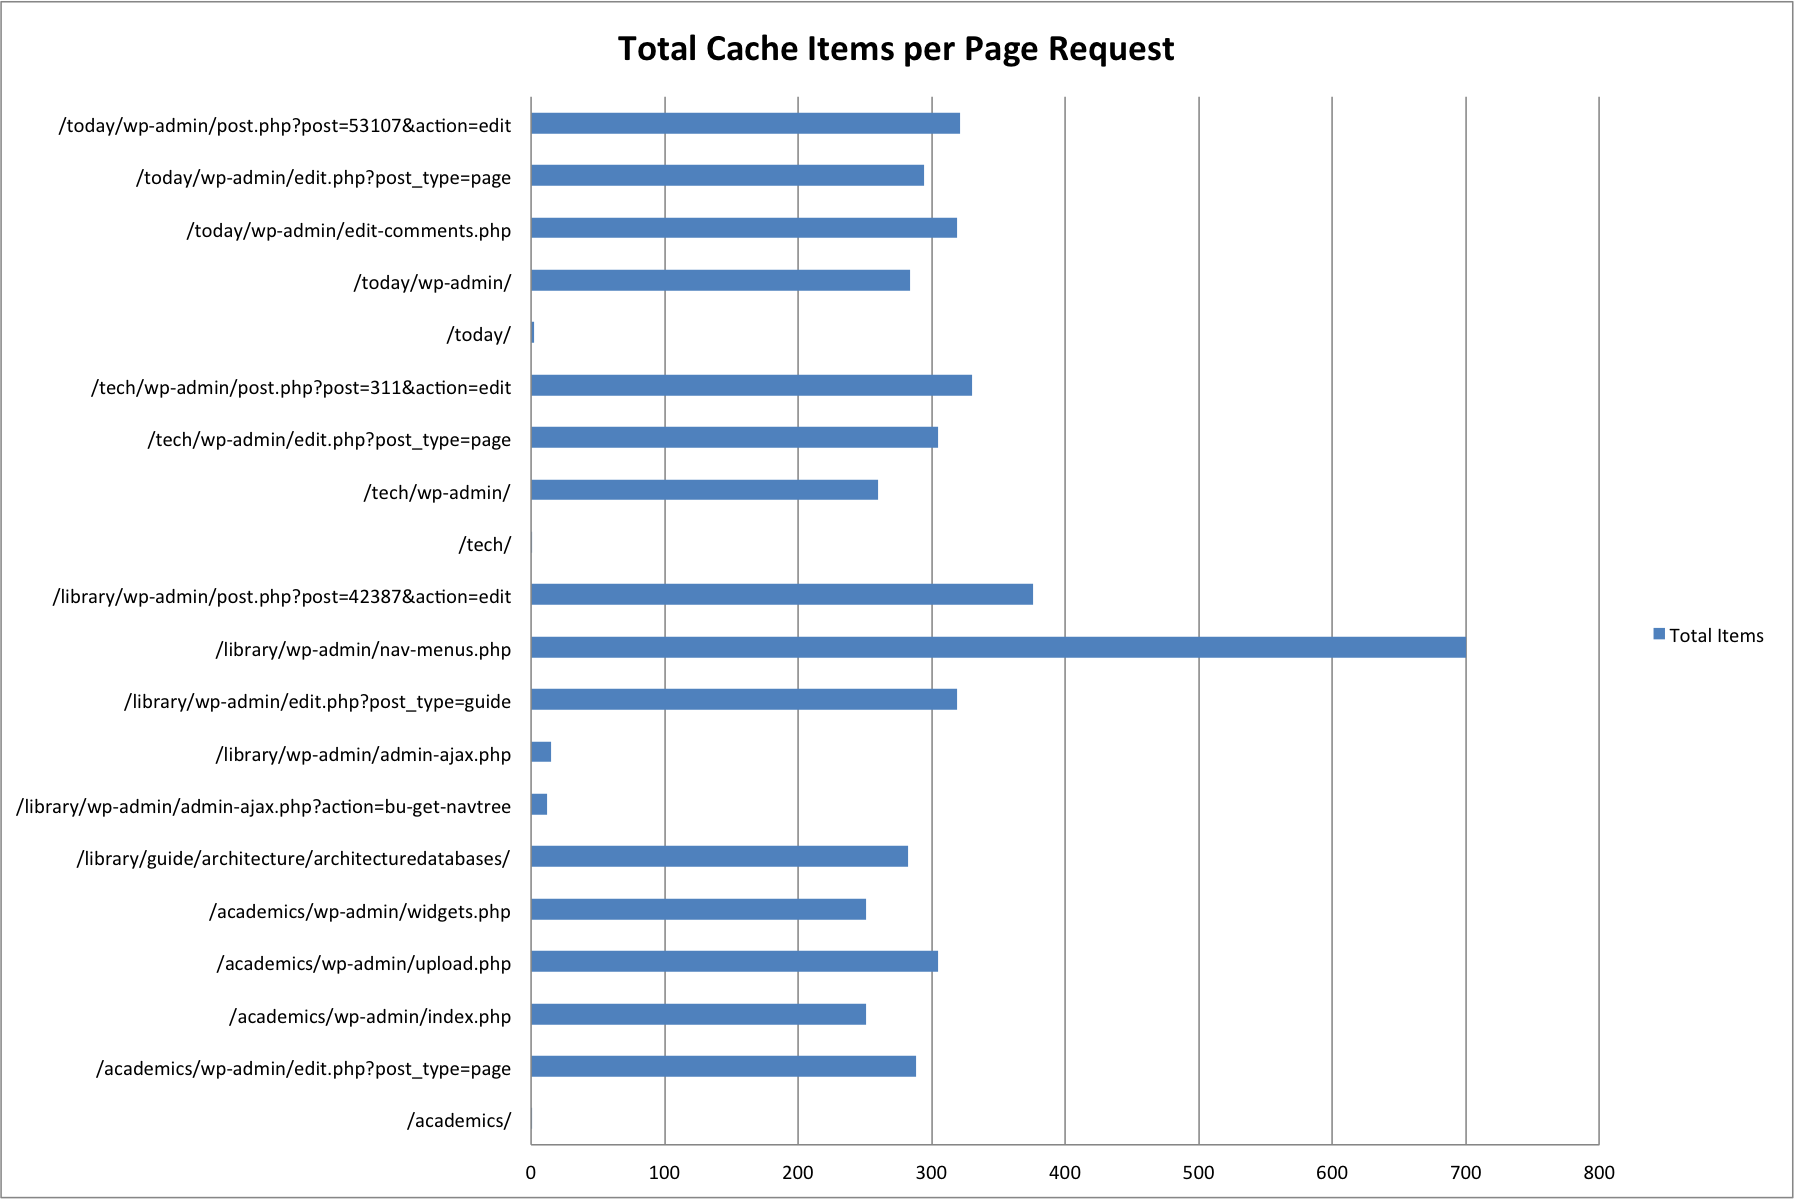
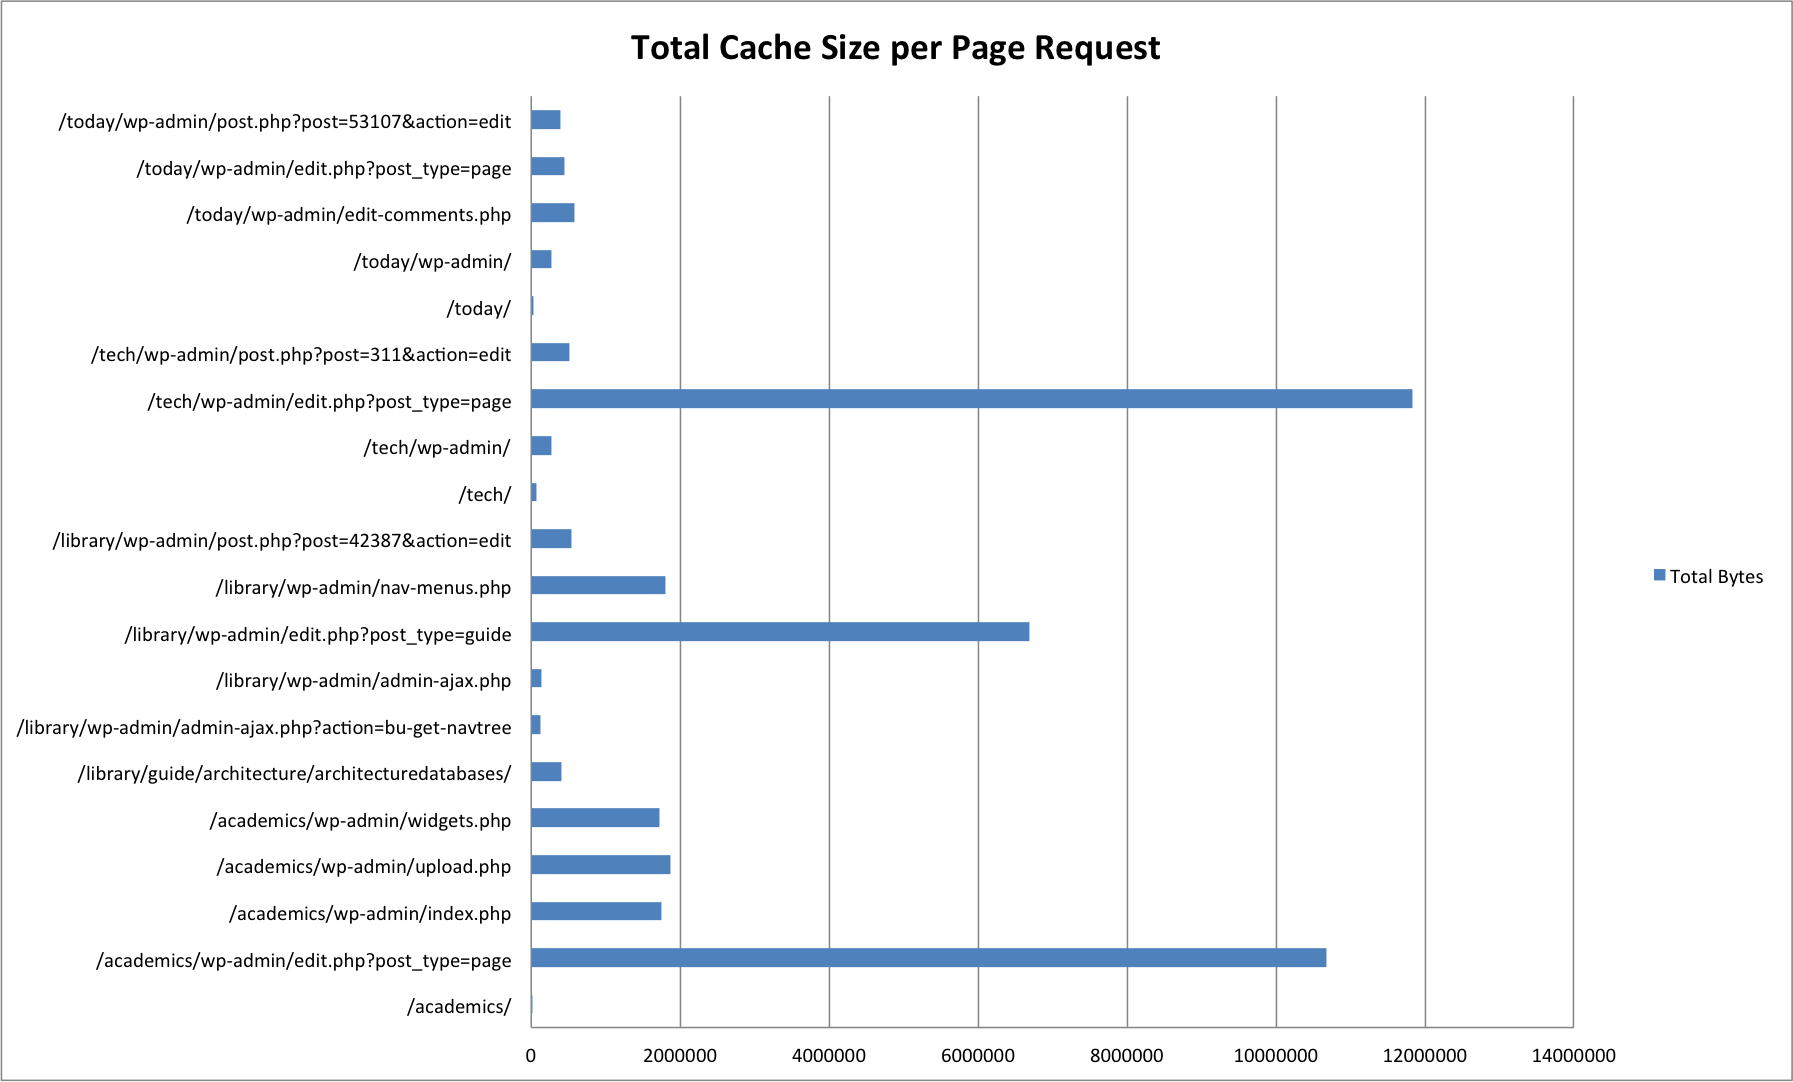
We generated sample cache data using 20 different pages across four of our more popular sites. Most of these page requests were for administrative pages (/wp-admin/), which make much heavier use of memcached in order to cache data structures returned from frequent / expensive database queries.
| URL | Cache Items | Size in Bytes |
|---|---|---|
| /academics/ | 1 | 15525 |
| /academics/wp-admin/edit.php?post_type=page | 288 | 10673318 |
| /academics/wp-admin/index.php | 251 | 1751822 |
| /academics/wp-admin/upload.php | 305 | 1867783 |
| /academics/wp-admin/widgets.php | 251 | 1723990 |
| /library/guide/architecture/architecturedatabases/ | 282 | 400303 |
| /library/wp-admin/admin-ajax.php?action=bu-get-navtree | 12 | 126930 |
| /library/wp-admin/admin-ajax.php | 15 | 136110 |
| /library/wp-admin/edit.php?post_type=guide | 319 | 6693282 |
| /library/wp-admin/nav-menus.php | 700 | 1805481 |
| /library/wp-admin/post.php?post=42387&action=edit | 376 | 536372 |
| /tech/ | 1 | 75212 |
| /tech/wp-admin/ | 260 | 270636 |
| /tech/wp-admin/edit.php?post_type=page | 305 | 11832297 |
| /tech/wp-admin/post.php?post=311&action=edit | 330 | 514797 |
| /today/ | 2 | 31772 |
| /today/wp-admin/ | 284 | 277221 |
| /today/wp-admin/edit-comments.php | 319 | 583105 |
| /today/wp-admin/edit.php?post_type=page | 294 | 441017 |
| /today/wp-admin/post.php?post=53107&action=edit | 321 | 396096 |
Pages without /wp-admin/ are front-end page requests. The majority of these have one or two cache items -- this is due to the Batcache plugin, which stores fully generated HTML pages for front-end page requests by unauthenticated users.
Benchmark Environments
We ran the benchmark script against two different environments:
- Systems Test / Development
- Production
For each environment we spun up isolated memcached instances to handle client requests from the benchmark script.
There were some notable variances between test environments.
Memcached Configuration
# Systems Test / Development
ist-wp-app-syst01$ memcached -d -p 11212 -m 64 -c 1024
ist-wp-app-devl01$ memcached -d -p 11212 -m 64 -c 1024

# Production
ist-wp-app-prod01$ memcached -d -p 11214 -m 128 -c 1024
ist-wp-app-prod02$ memcached -d -p 11214 -m 128 -c 1024
ist-wp-app-prod03$ memcached -d -p 11214 -m 128 -c 1024
Where -p is the port to accept requests on, -c is the maximum amount of concurrent connections to accept, and -m is the amount of memory to allocate. Note that the sample data did not exceed 64M in size, and as such this variance did not make any difference -- there were no cache evictions reported during test runs.
The benchmark scripts were run from ist-wp-app-syst01 for Systems Test / Development, and ist-wp-app-prod01 for production.
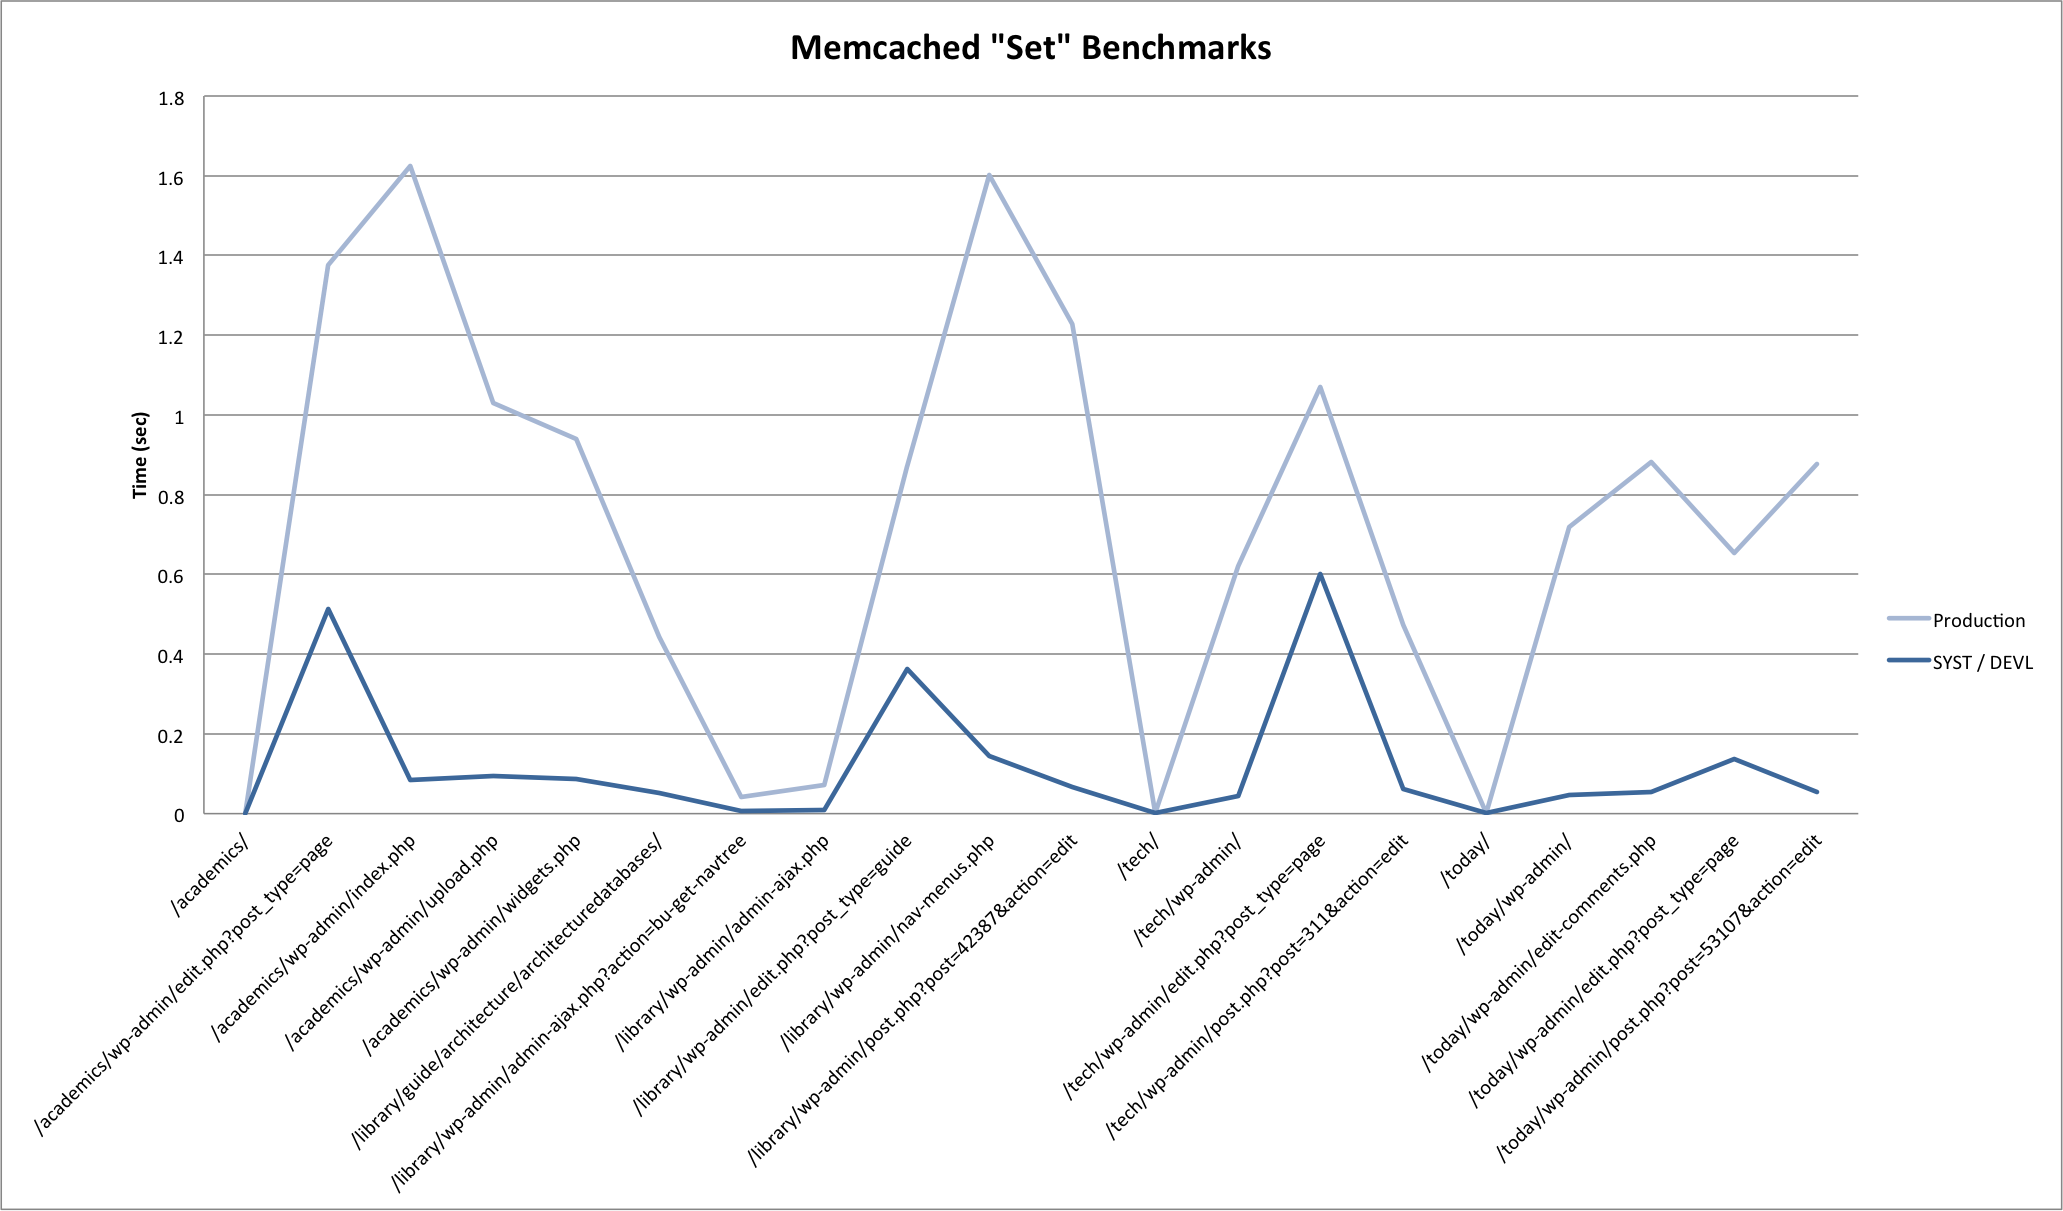
System Usage
While we did run the prod benchmarks during a low-traffic period, system usage was still vastly different from SYST / DEVL due to the volume of web requests being handled on the boxes running memcached. Systems test and development served a combined 68565 requests over a 24 hour period during which the benchmarks were run. In contrast, the production servers handled 4957761 during that same period.
15-minute load average across the 3 prod app servers averaged 2.1 during benchmark tests, with CPU usage hovering around 40%. This is compared to a 0.1 load average on ist-wp-app-devl01, with 5% CPU usage. (And even less on ist-wp-app-syst01).
Needless to say, we were not expecting the same results between environments.
Approach
The benchmark script does the following, starting from an empty cache:
- Set all cache items for a given page request
- Get all cache items for a given page requests
- Delete all cache items for a given page requets
It carries out these operations sequentially in two modes -- pooled, and once per server.
With this test approach in mind, we were looking for answers to the following:
- How long do set, get and delete operations typically take in our environments?
- How do response times vary for these operations when the memcached server is local to the client? On the same blade? On a different blade?
- How do response times vary when the system is under load?
Results
Here are some graphs generated from the benchmark results. Click through to the attachment pages for some commentary.
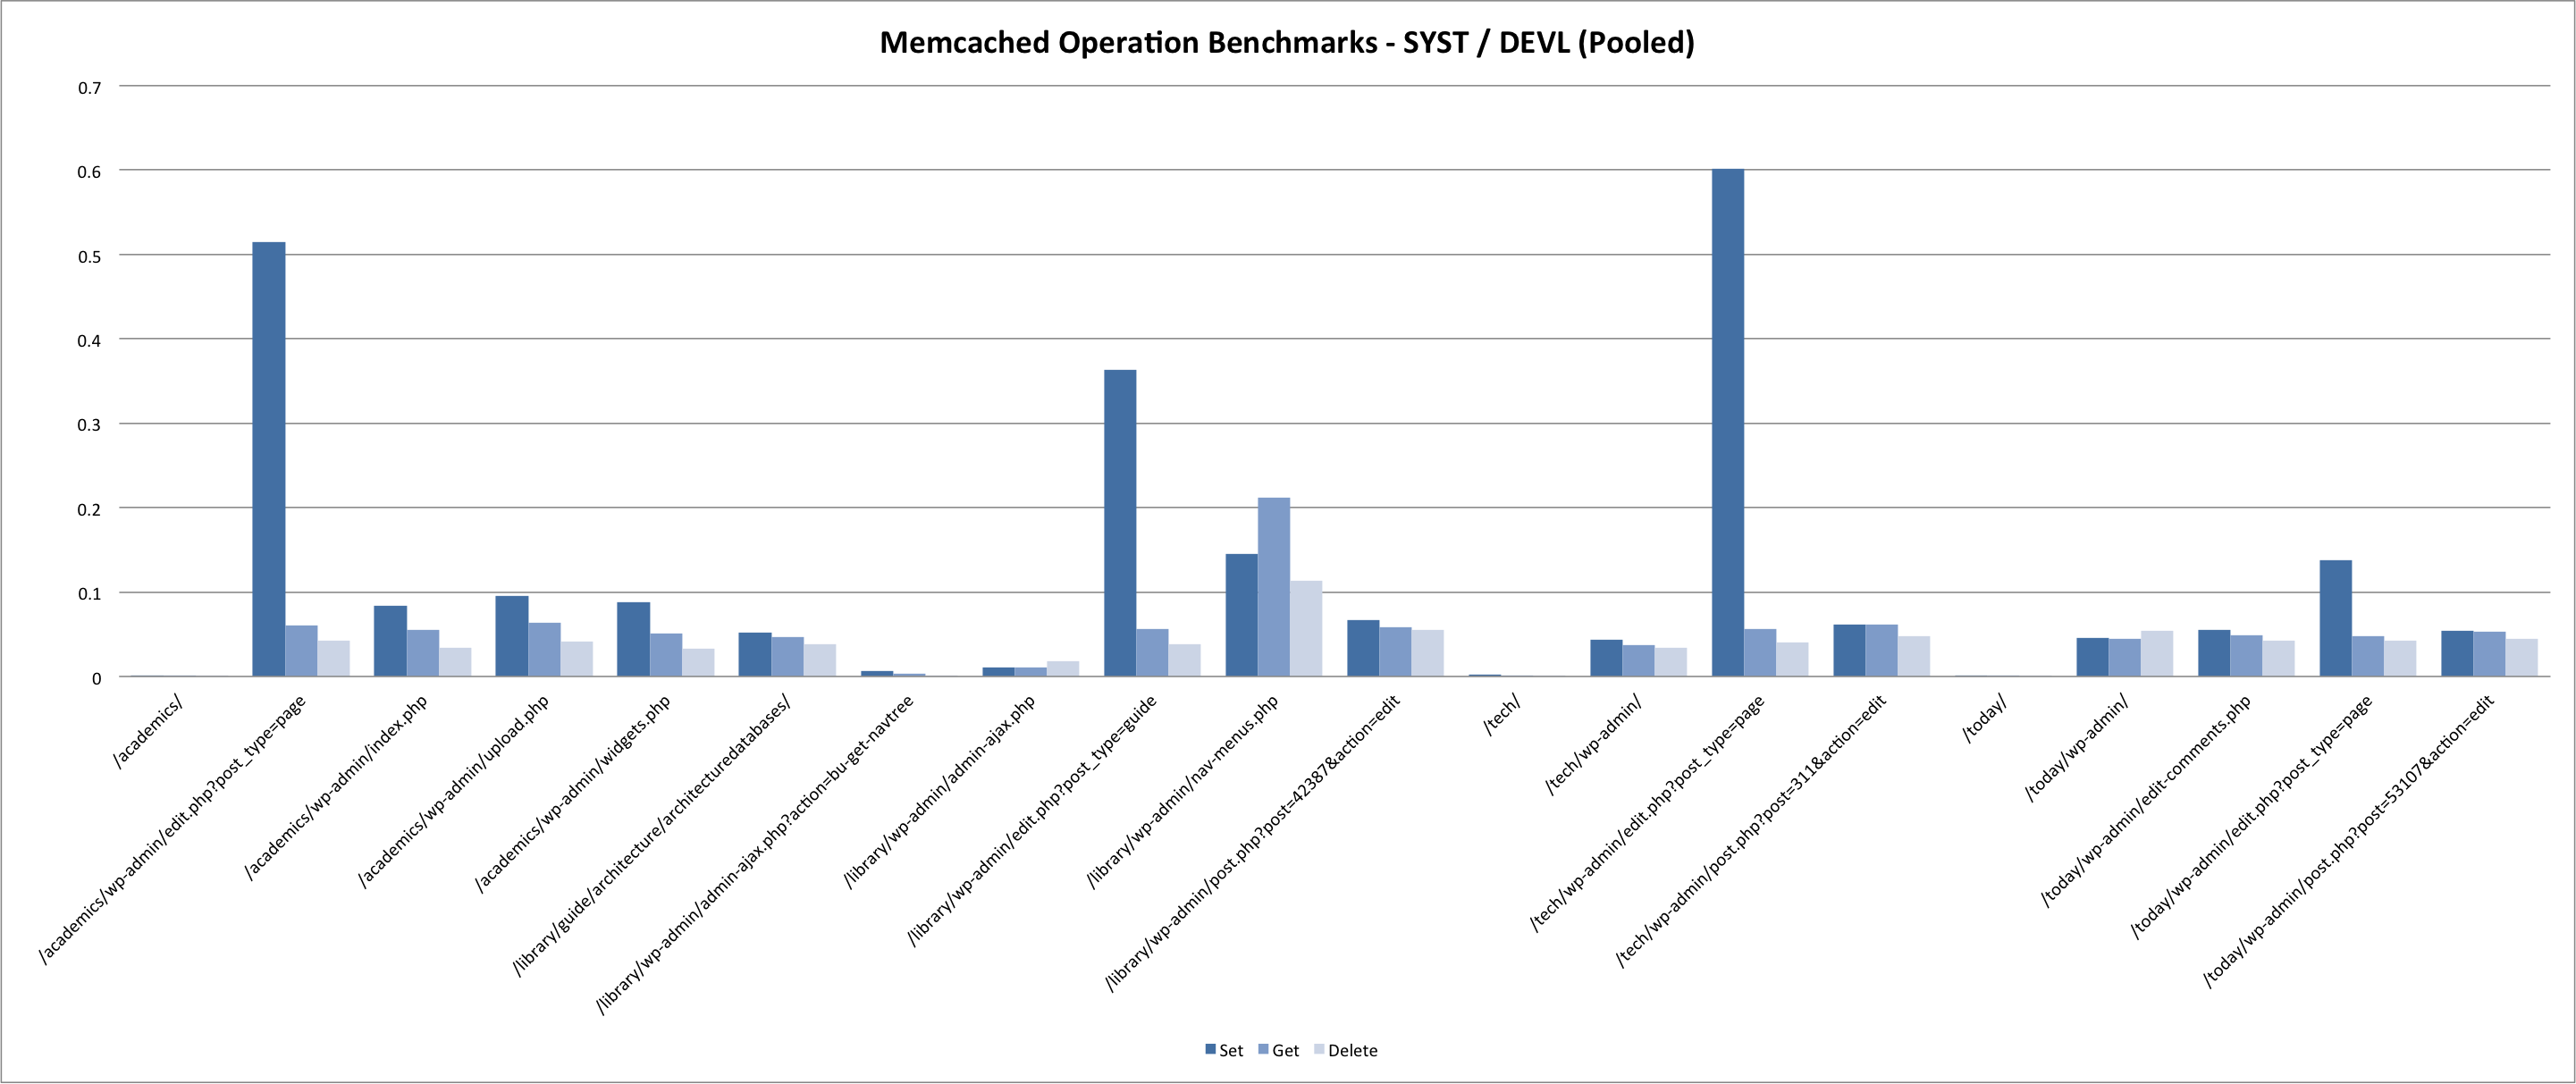
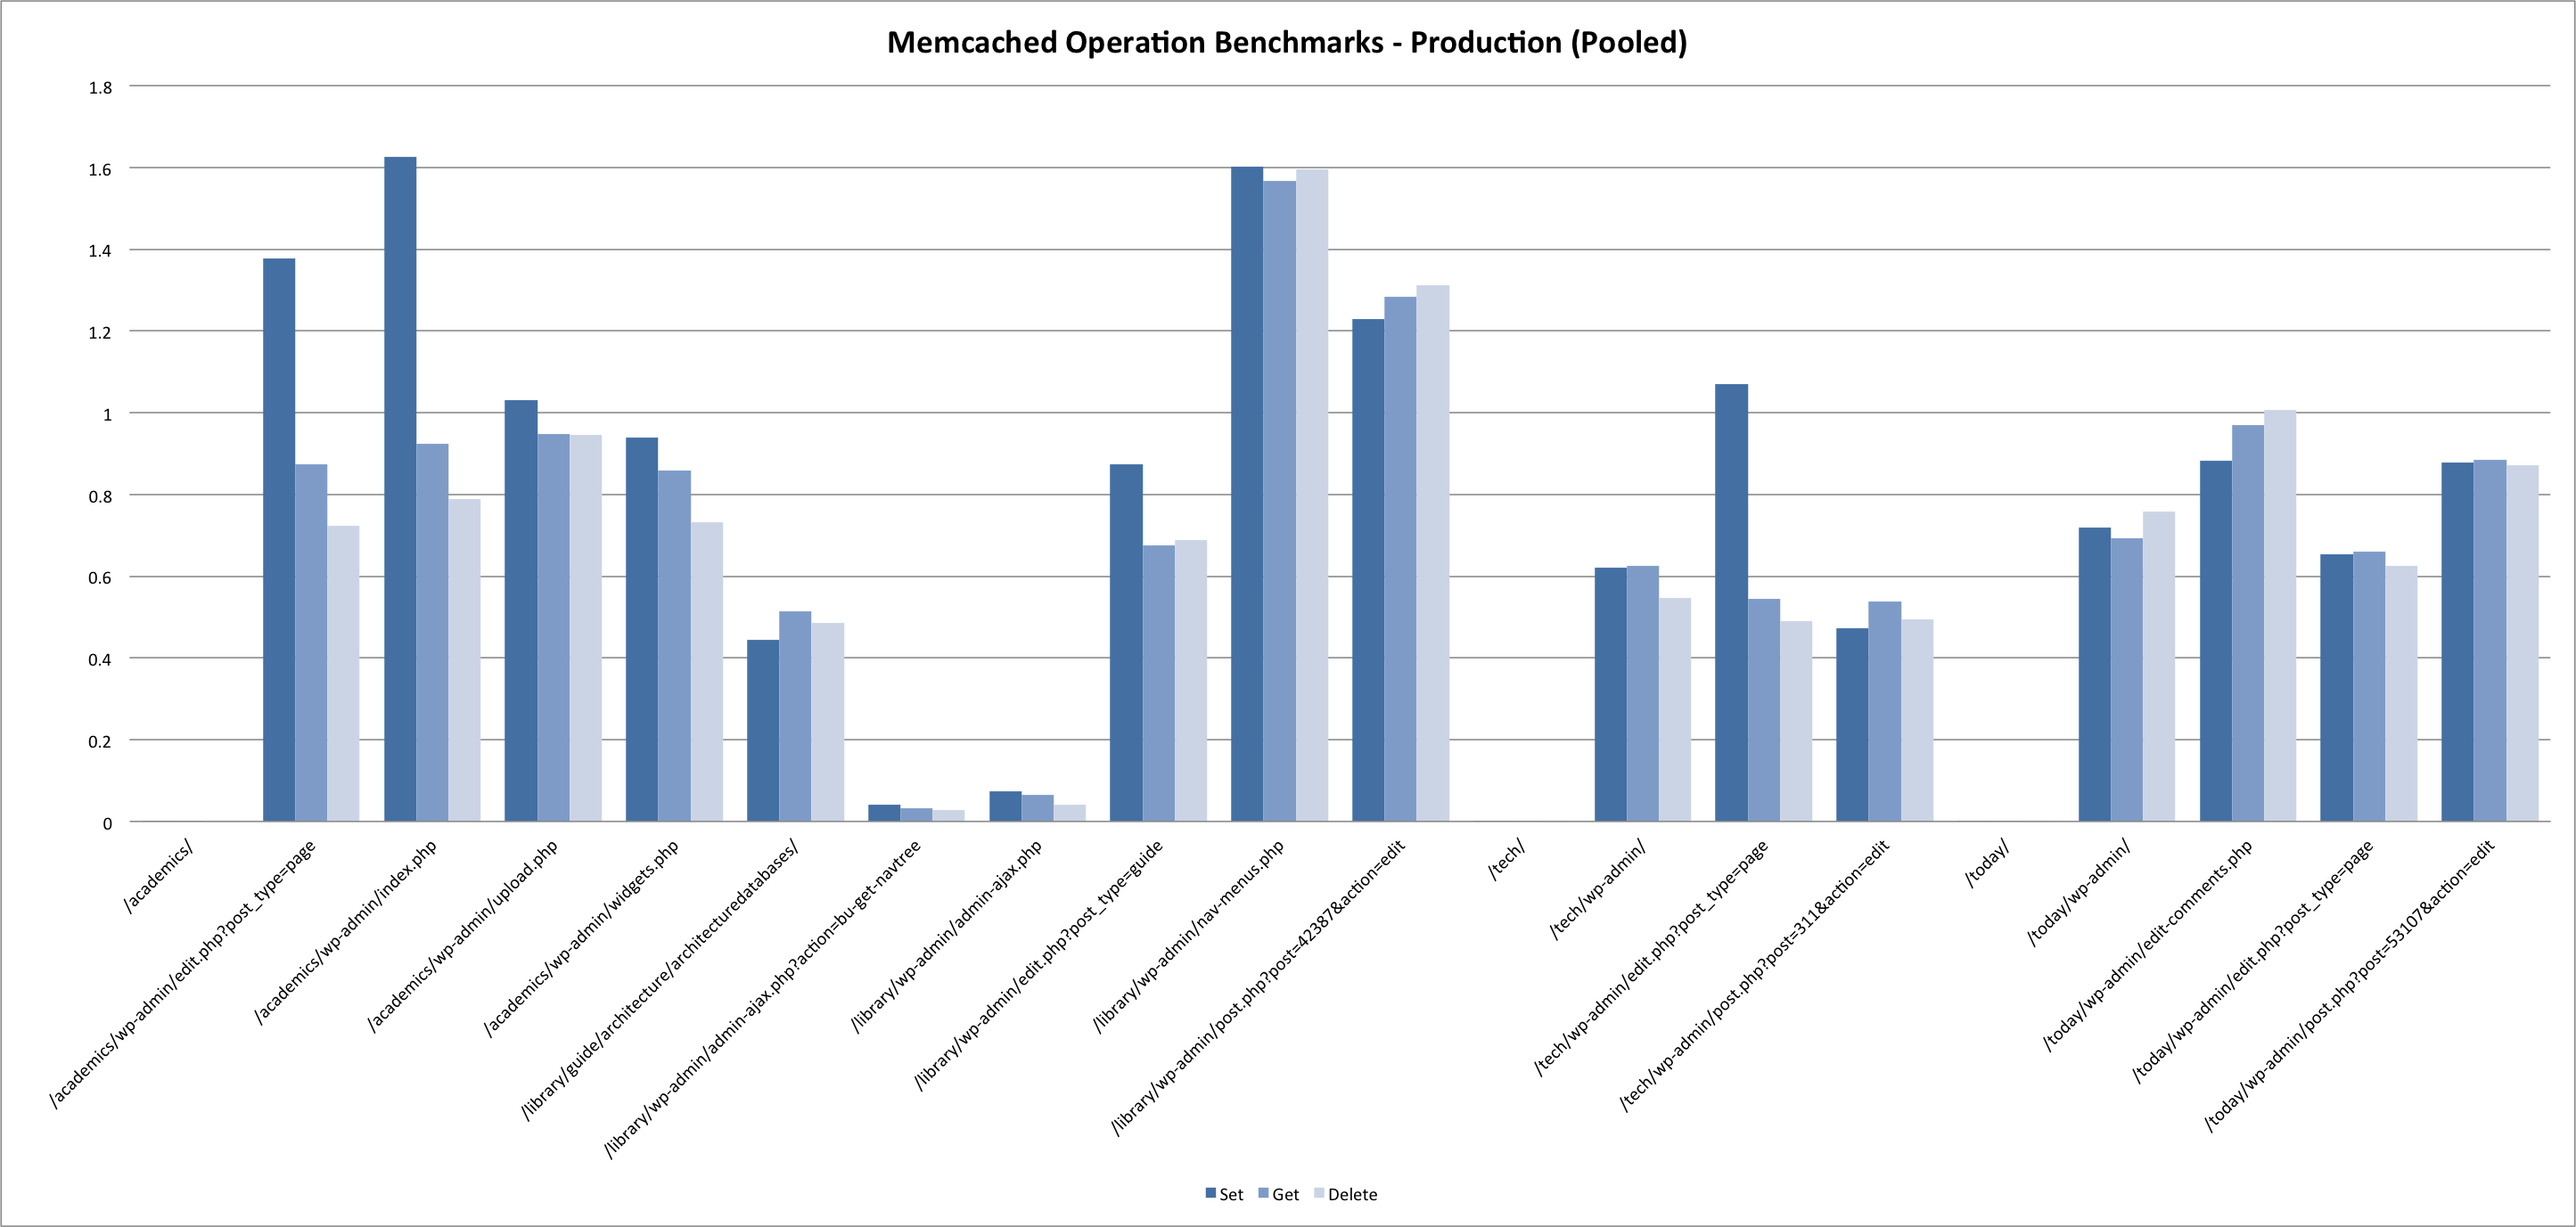
Summary
Results pretty much confirmed what you would expect. In summary:
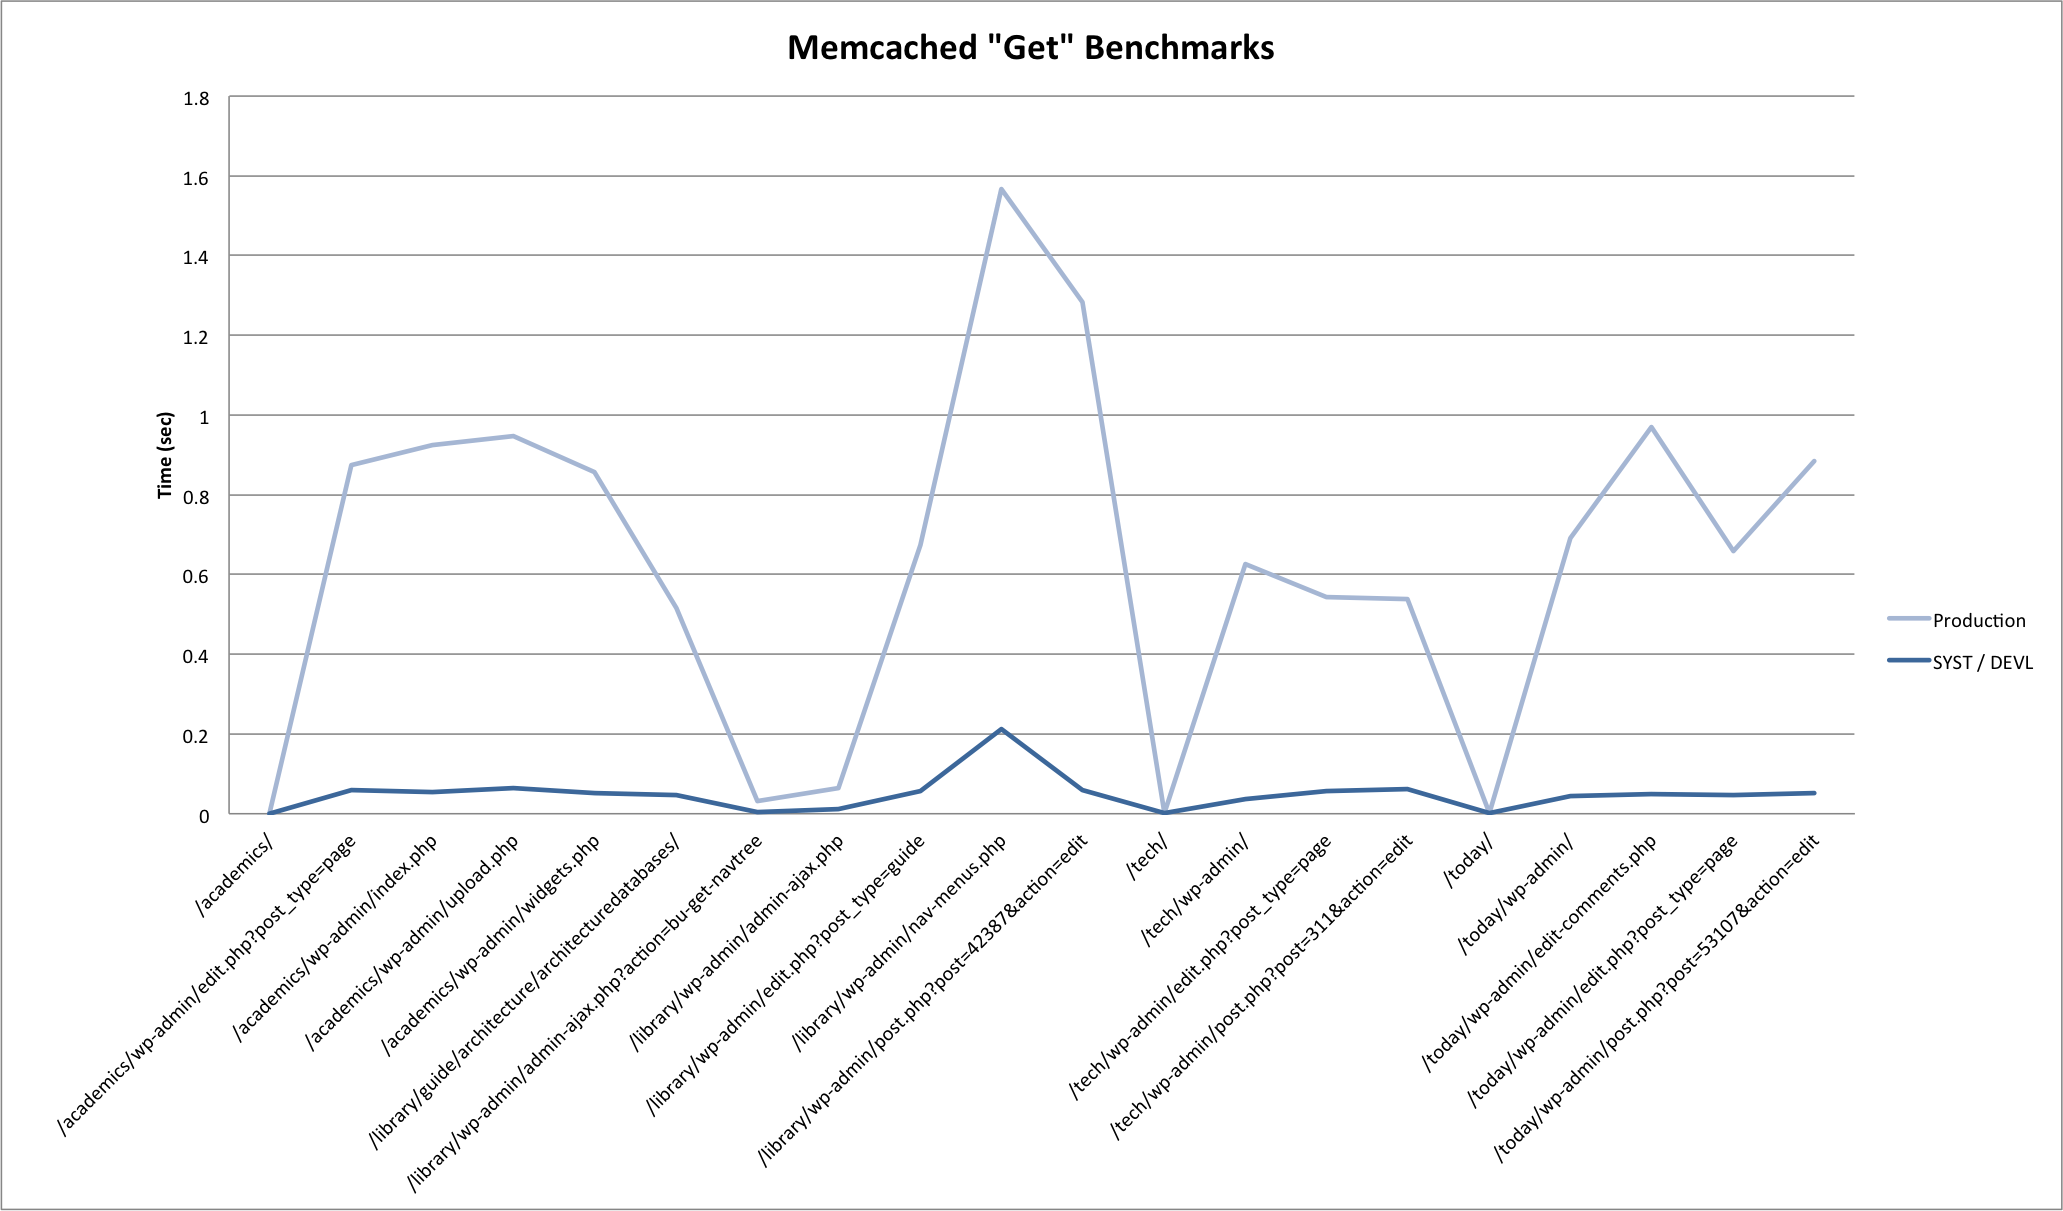
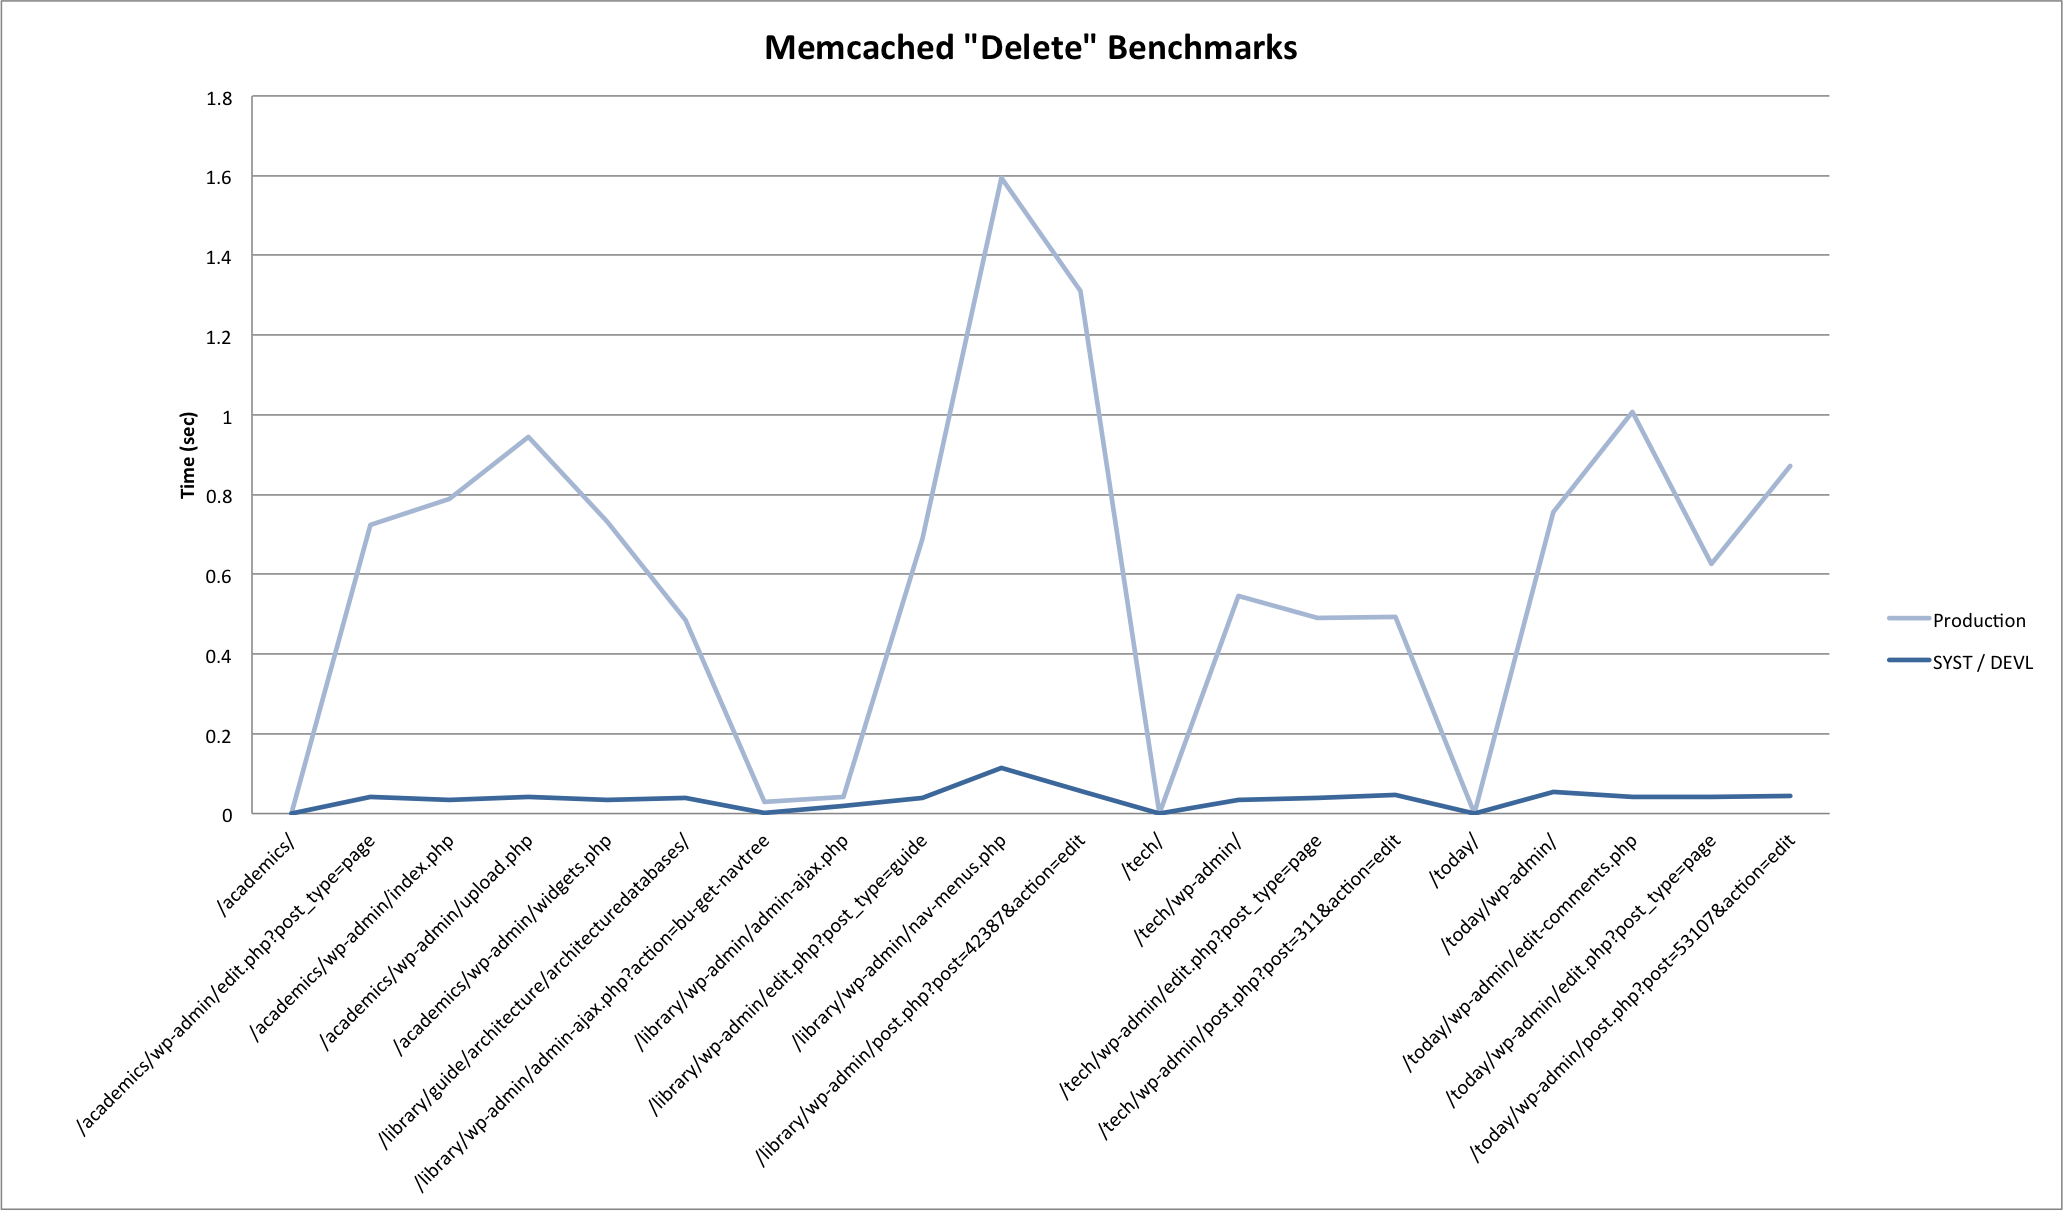
- Set is slower than get is slower than delete.
- Local requests are much faster then remote requests. For production, requests on the same blade (prod01 -> prod02) were marginally faster then requests across blades (prod01 -> prod03).
- System load greatly impacts response times for all memcached operations.
And some more questions...
- How much (if any) would response times improve by moving memcached to servers that were not overloaded serving web requests?
- How expensive are evictions? Default TTL for cache items is indefinite in the WordPress object cache plugin -- should we consider expiring items at the cost of more frequent set operations?
More on that first point in a follow-up post, coming soon.
Analyzing access logs
As part of the effort to put together better load tests, I've written a simple shell script for performing some access log analysis. Use fetch.sh to obtain log files from production servers and analyze.sh <directory containing files> to perform analysis. This will take up a bit of space for a single day.
After running this script there will be new files in the directory showing wp-admin and admin-ajax requests ordered by frequency for the day.
Fetch scripts from github.
So far after looking at several days of results, some preliminary items of note are:
- Most wp-admin requests are to admin-ajax.php.
- Roughly half of those admin-ajax.php requests, roughly half are POSTS.
- Roughly half f those POSTs to admin-ajax.php (and surprisingly some of the GETs) have no action in the URL that we can use to identify what's being done. This is a significant amount of our admin.
I'm compiling a list of use cases for test planning here.